

Introduction
Many common diseases are the result of both genetic and environmental factors. Genetic risk scores (GRS) are probabilistic models that estimate an individual’s risk of developing a disease. They are not diagnostic, but may reduce risk when considered during embryo selection.[1]
Current GRS capture only part of an individual’s genetic risk and are primarily limited by the availability of training data.[2] This data typically comes from biobanks, large research institutions that curate the genetic and health data of millions of individuals. This data allows us to better estimate the small effects of hundreds of thousands of genetic variants. As biobanks publish more data, Orchid releases improved models — and can reanalyze prior reports by request. These improvements can be substantial. Some of the updated GRS are projected to reduce up to 50% more risk when selecting among five otherwise genetically healthy embryos.
In many cases, the new risk estimates will closely match those from the original report, but scores may change — sometimes substantially. This is expected. Predictions will change as GRS improve.
GRS and Embryo Selection: A Simplified Example
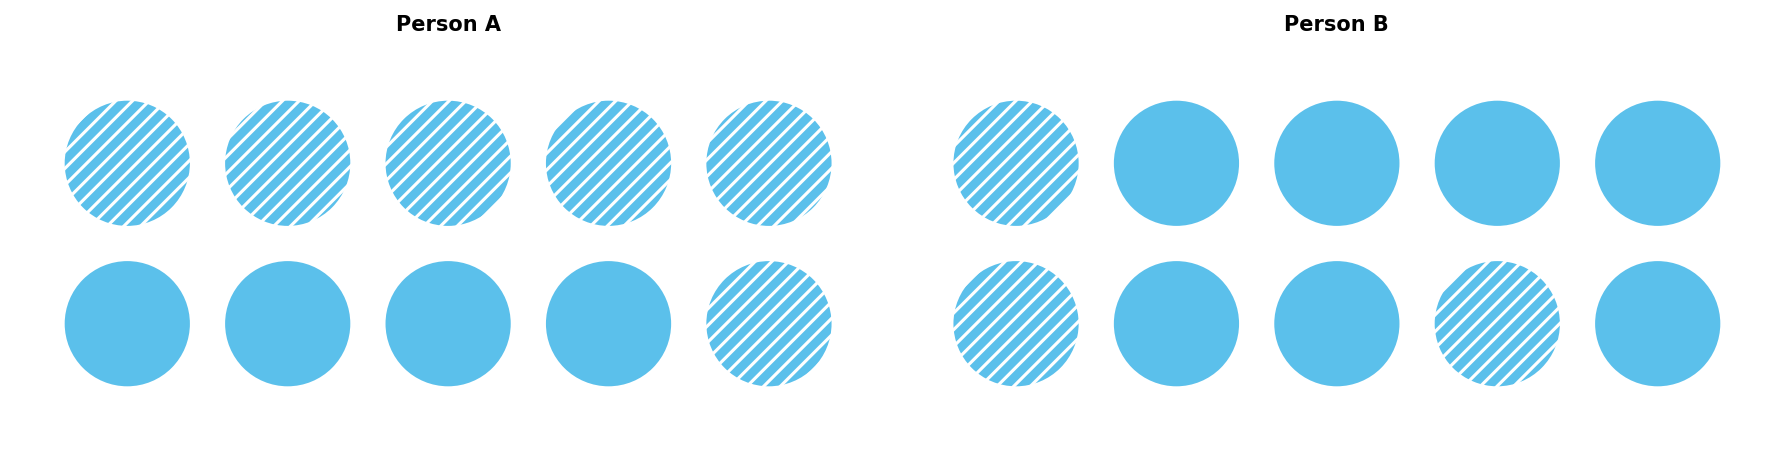
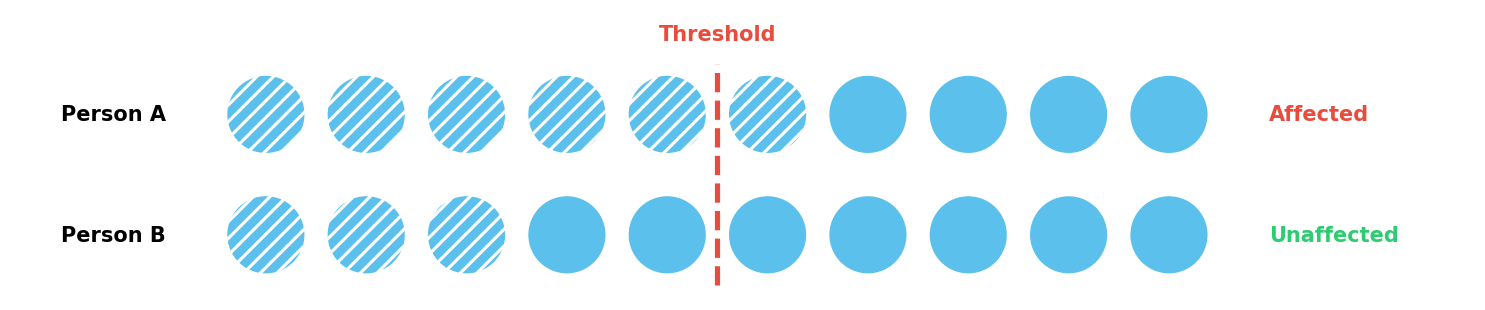
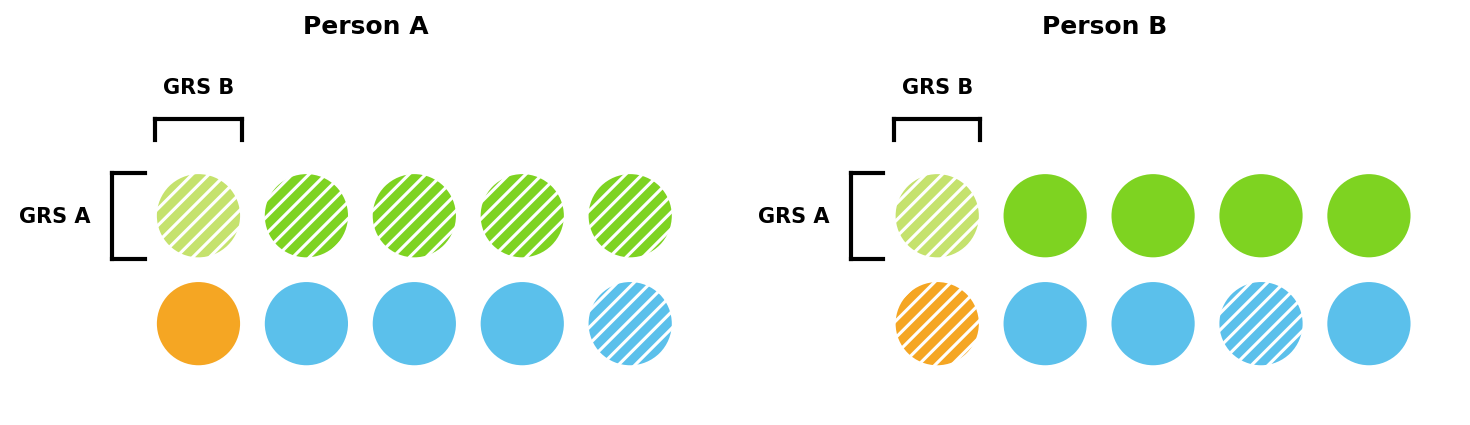
Many common diseases arise from both genetic and environmental effects, which can be modeled using a liability threshold framework.[3] In this framework, an individual develops the disease if and when they accumulate a certain number of risk factors.
Consider a simplified example with ten risk factors and a threshold of five. In Figure 1, Person A has six factors and develops the disease, whereas Person B only has three and does not.
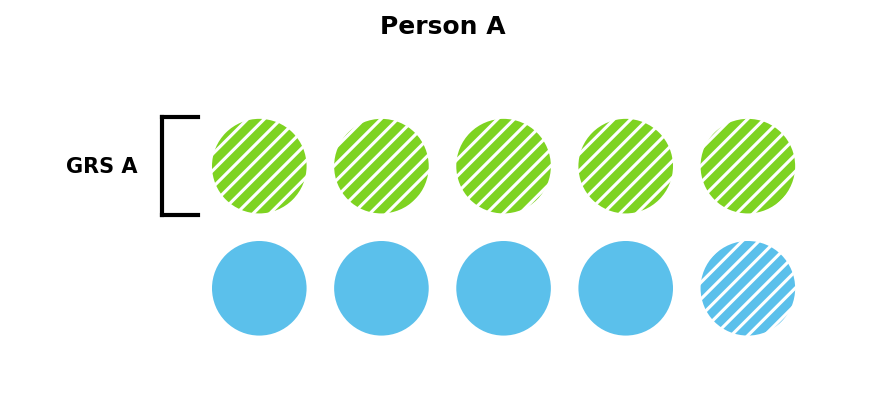
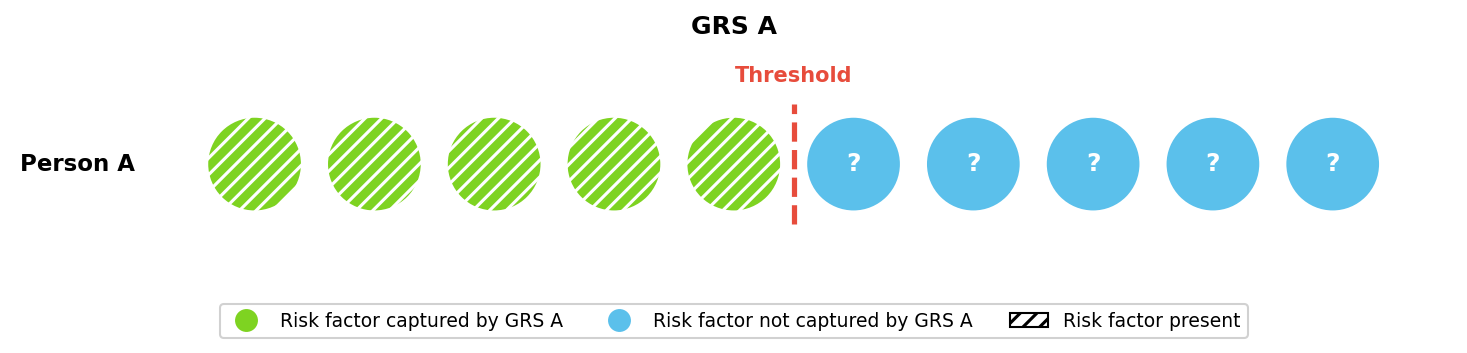
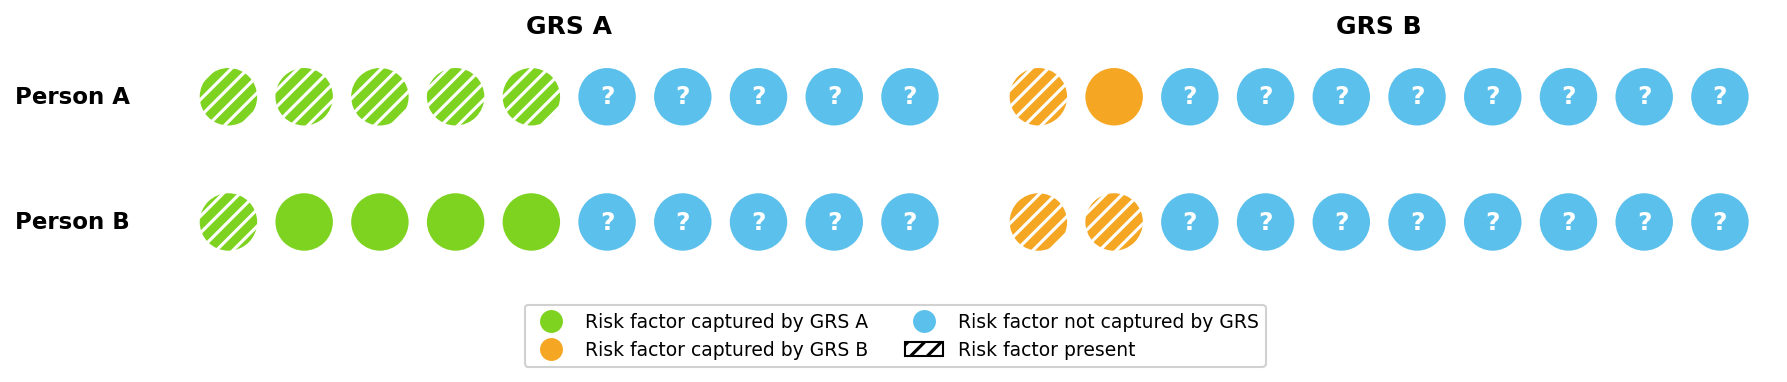
GRS capture some of these risk factors when estimating risk. GRS A in Figure 2 captures five of Person A’s six risk factors, and so would estimate Person A has a very high risk of developing the disease — only one out of the additional five risk factors would need to be present.
Different GRS capture different risk factors, with more powerful GRS capturing a larger share. This can lead to different risk estimates. In Figure 3, GRS A captures substantially more of Person A’s risk than GRS B and would therefore estimate a much higher risk. Figure 3 also shows that different GRS may rank individuals’ risk differently. GRS A predicts Person A has a higher risk than Person B, while GRS B predicts the opposite.
Recent GRS Improvements
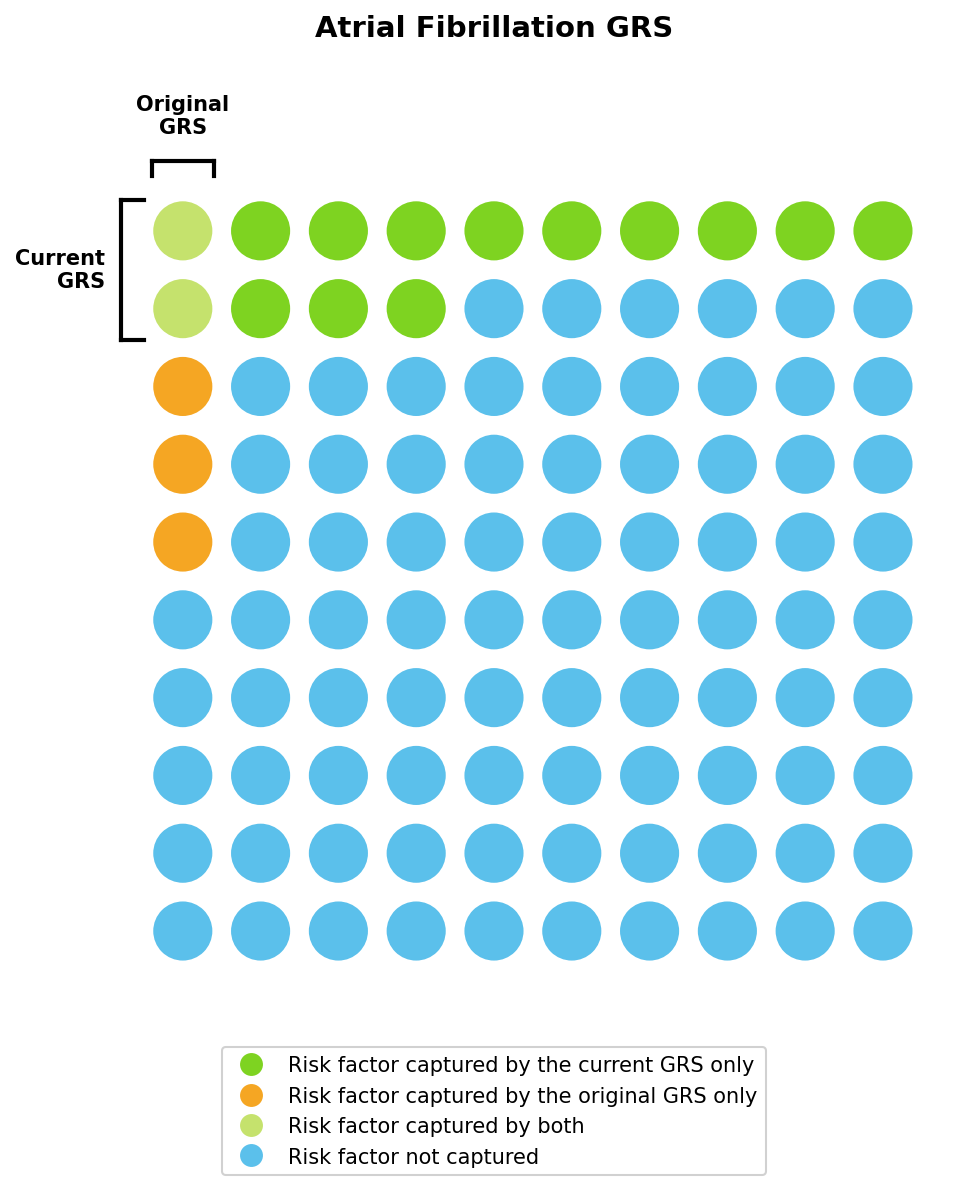
GRS predict risk by combining the small effects of hundreds of thousands of genetic variants. This is an extremely data-intensive process, and we update our models as new data becomes available. This can lead to substantial improvements in predictive power. For example, our current atrial fibrillation GRS captures ~14% of risk, nearly three times as much as the previous model. Families of European ancestry selecting from five otherwise genetically healthy embryos will see their projected risk reduction increase from 19% to 30% using the updated model. See Table 4 for a complete comparison of the GRS updated in January 2026.

We can visualize these improvements using the liability threshold framework introduced earlier (Figure 5), with the original and current GRS capturing approximately 5% and 14% of total risk, respectively. As in our toy example, these two GRS may estimate different lifetime risks for the same individual.
Correlation Between Original and Current GRS
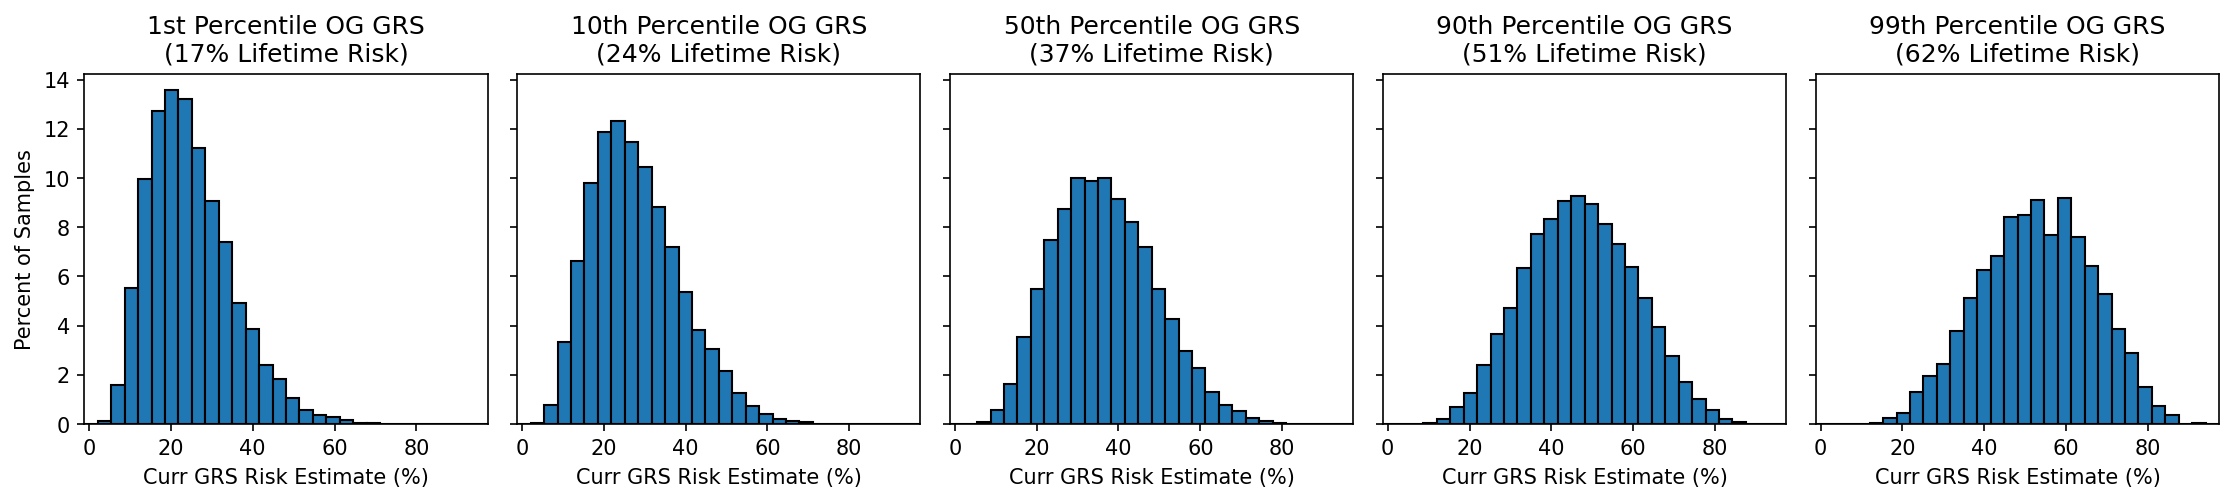
The risk estimates from the original and current GRS will often closely match, but some estimates may change. For example, if the original model predicted someone had a 49% lifetime risk of developing a disease, what would the current GRS predict? Figure 6 shows a few such distributions, looking at individuals the original atrial fibrillation GRS predicted were in the 1st, 10th, 50th, 90th, and 99th percentile of risk. Low-risk estimates generally remain low and high-risk estimates remain high, but there are exceptions: a small number of people who got a low risk estimate will now have a high risk, and vice versa.
Summary
The current GRS are closely correlated with earlier versions, so many risk estimates won’t change much. However, some risk predictions will change. This is expected as genetic data from millions of individuals improves our ability to build predictive genetic models using the combined genetic effects from hundreds of thousands of genetic variants. These changes represent the continued improvement of GRS over time. To request a reanalysis using updated genetic risk scores or to learn more about how Orchid reports GRS, contact genetics@orchidhealth.com.
References
[1] Lencz, Todd et al. “Utility of polygenic embryo screening for disease depends on the selection strategy.” eLife vol. 10 e64716. 12 Oct. 2021, doi:10.7554/eLife.64716
[2] Chatterjee N, Wheeler B, Sampson J, Hartge P, Chanock SJ, Park JH. Projecting the performance of risk prediction based on polygenic analyses of genome-wide association studies. Nat Genet. 2013;45(4):400-405e4053. doi:10.1038/ng.2579
[3] Lee, Sang Hong et al. “A better coefficient of determination for genetic profile analysis.” Genetic epidemiology vol. 36,3 (2012): 214-24. doi:10.1002/gepi.21614


