

Overview
In this whitepaper, we describe a method to improve the performance of genetic risk scores (GRS) across multiple ancestries – including European, East Asian, South Asian, and African populations. The method leverages predictions from genetically correlated traits and GWAS (genome-wide association study) of non-European ancestry. We replicate previous research[1][2] that used pleiotropy to improve prediction accuracy and make further gains by incorporating newly developed methods[3][4] that use ancestrally diverse GWAS data, which capitalize on the diversity of linkage disequilibrium across discovery samples. By integrating these two sources of data, we successfully improved the predictive performance of GRS for a wide range of diseases for Europeans, with a relative increase in effect size (log odds ratio per standard deviation of GRS) with a inverse-variance weighted average increase of 23.7% across n = 8 diseases. Consistent with other work[1], the predictive performance also improved in non-Europeans, with a 24.8% average relative increase in effect size for South Asians, and 29.6% for Africans. Due to the inclusion of a large East Asian biobank, the improvement in prediction was particularly remarkable among East Asians, where the gain was 53.6%. This approach promises to advance the use of genetic risk prediction in preimplantation genetic testing by providing more accurate and inclusive scores for diverse populations.
Data and Validation Cohorts
The models for a set of 8 diseases were improved by adding in new data from several sources: non-European data from the Biobank of Japan[5], Finnish data from FinnGen[6], and genetically correlated traits from within the UK Biobank (discovered by examining the UK Biobank Genetic Correlation browser from the Neale Lab). These were compared to the original models developed by using a standard approach of taking a large GWAS and creating a polygenic score using the PRScs[7] software or pruning and thresholding[8].
For quality control, we removed samples that failed standard quality control(due to missing genotypes, genetic sex not matching self-reported sex, and genetic ancestry not matching self-reported ancestry). For the African/Caribbean, South Asian, and East Asian cohorts, we removed any samples that were genetically related (up to 3rd degree) to other samples in the UK Biobank. For the White British samples, we split the dataset into two cohorts:
- Cohort 1: Samples with no relatives (up to third degree) within the UK Biobank (n=276,471)
- Cohort 2: Samples with one or more relatives in the UK Biobank, where one relative from each family was selected (n=58,808)
For type 2 diabetes and coronary artery disease, we trained GRS models that include cohort 1 and tested on cohort 2 as validation. For all other conditions, we tested on cohort 1 since we did not use any UK Biobank GWAS data.
Incorporating Genetically Correlated Traits
A number of research papers have shown predictive performance improves by creating a linear combination of polygenic score models (multi-PGS) whose weights are determined with elastic net regularization. For example, including the PGS for schizophrenia as a feature in predicting depression improves the prediction of the latter[1]. For two of these diseases – breast cancer and atrial fibrillation – there were no strongly genetically correlated traits in the UK Biobank or otherwise.
For the three psychiatric conditions (depression, bipolar disorder, schizophrenia), because each is significantly genetically correlated with the other two[9], we built a multi-PGS on all predictors for the three psychiatric disorders.
For type 2 diabetes, class III obesity and coronary artery disease, we scanned the UK Biobank for the top 25 ranked by genetic covariance and trained GRS models using PRScs software.
Incorporating East Asian and Finnish GWAS
For all diseases we included data from FinnGen using models trained with PRScs. Additionally, we employed a multi-ancestry approach, PRScsx, to jointly analyze European and East Asian data from the Biobank of Japan. This technique has demonstrated enhanced predictive performance among East Asians and, in some circumstances, improved relative performance for Africans and South Asians.
Table 2: Description of benchmark PGS and additional data used to train improved models.
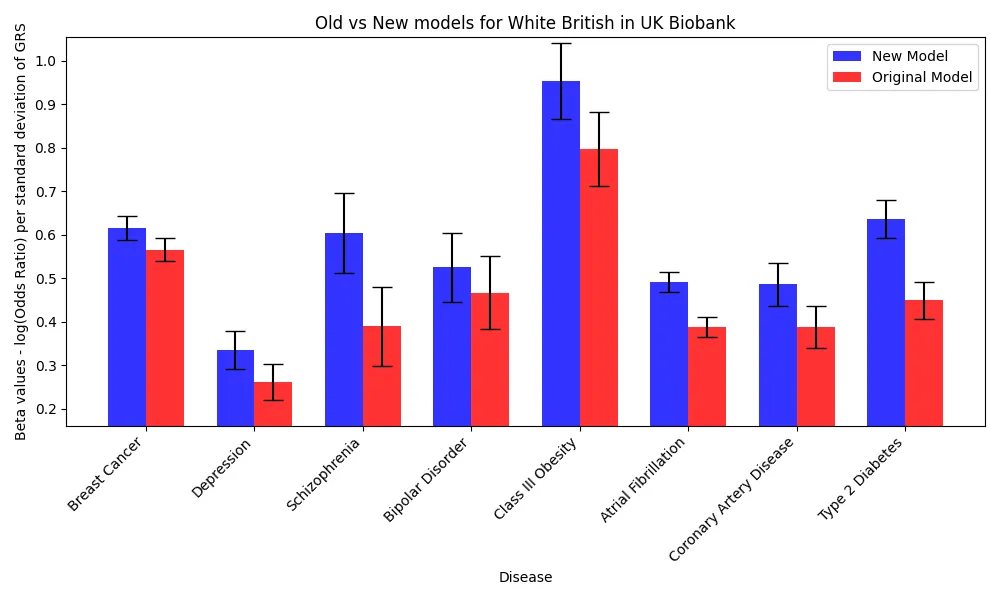
Results for Europeans
For each disease, the collection of trained models were combined into a multi-PGS with a logistic regression using elastic net regularization. Performance for these diseases was evaluated on the Cohort 1, except for CAD and Type 2 Diabetes, which were evaluated on Cohort 2 because their multi-PGS incorporated models trained on the Cohort 1. Improvements were strong, with a mean improvement of 28.2% in effect sizes (log odds ratio per standard deviation) across the 8 diseases. This estimate weighs each disease equally, but the error bars are wider for more rare diseases, so we also report the average improvement weighted by inverse of the standard errors, which is 23.7% for Europeans. Relative performance increases were the strongest in type 2 diabetes and schizophrenia, which can be explained by the large numbers of cases in the additional data and the high SNP heritability of the disease.
Performance Improvements successfully generalized across ancestries
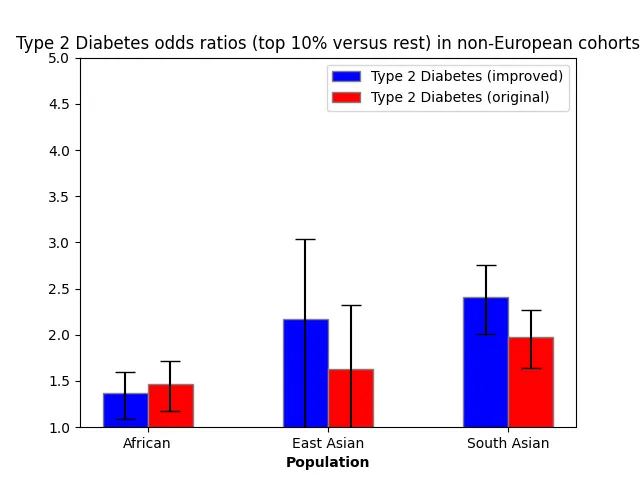
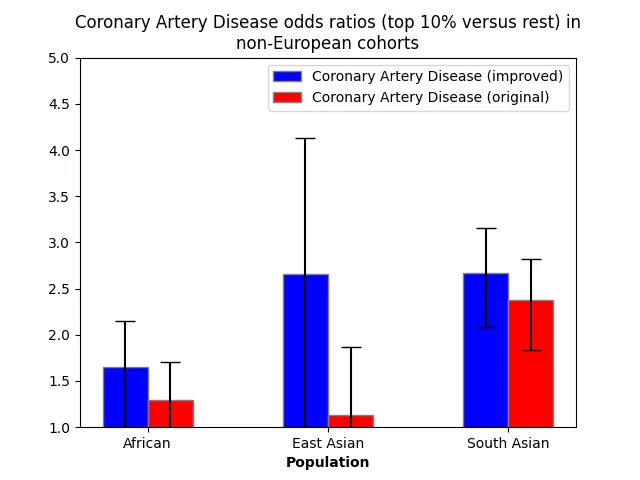
Genetic risk score performance improved across all ancestries, with East Asians having a gain relative to Europeans due to the inclusion of data from the Biobank of Japan. The gains were particularly significant within the East Asian population, which aligns with the majority of non-European GWAS data used originating from the Biobank of Japan.
Table 3: Improvements in performance across different ancestries by inverse weighted variance. Inverse weighted variance is a weighted average that assigns weights to quantities by the inverse of the variance, i.e. the precision of the estimate, which assigns more weight to diseases with larger numbers of cases.
For the two most common diseases in the UK Biobank (coronary artery disease and type 2 diabetes), we depict here the odds ratios of the top 10% of PRS versus the bottom 90% in the improved and original models.
Discussion
We have evaluated the performance of predictors that incorporate non-European GWAS and genetically correlated traits, showing that the performance improves across all ancestries. Relative performance increases were especially high in East Asians because of the joint inference on multi-ancestry data that included the Biobank of Japan. The results demonstrate that the performance of Genetic Risk Scores scores can be improved by diverse data and replicate the findings that summary statistics from large non-European biobanks can help improve equity in genomic medicine.
Citations
- Albiñana, C., Zhu, Z., Schork, A. J., Ingason, A., Aschard, H., Brikell, I., ... Vilhjálmsson, B. J. (2022). Multi-PGS enhances polygenic prediction: weighting 937 polygenic scores. medRxiv, 2022.09.14.22279940. https://doi.org/10.1101/2022.09.14.22279940
- Truong, B., Hull, L. E., Ruan, Y., Huang, Q. Q., Hornsby, W., Martin, H. C., ... Natarajan, P. (2023, March 23). Integrative polygenic risk score improves the prediction accuracy of complex traits and diseases. medRxiv [Preprint]. 2023.02.21.23286110. https://doi.org/10.1101/2023.02.21.23286110
- Ruan, Y., Lin, Y. F., Feng, Y. A., Chen, C. Y., Lam, M., Guo, Z., ... Ge, T. (2022, May). Improving polygenic prediction in ancestrally diverse populations. Nat Genet, 54(5), 573-580. https://doi.org/10.1038/s41588-022-01054-7
- Zheng, Z., Liu, S., Sidorenko, J., Yengo, L., Turley, P., Ani, A., ... Zeng, J. (2022). Leveraging functional genomic annotations and genome coverage to improve polygenic prediction of complex traits within and between ancestries. bioRxiv, 2022.10.12.510418. https://doi.org/10.1101/2022.10.12.510418
- Nagai, A., Hirata, M., Kamatani, Y., Muto, K., Matsuda, K., Kiyohara, Y., ... Nakamura, Y. (2017, March). Overview of the BioBank Japan Project: Study design and profile. J Epidemiol, 27(3S), S2-S8. https://doi.org/10.1016/j.je.2016.12.005
- Kurki, M. I., Karjalainen, J., Palta, P., et al. (2023). FinnGen provides genetic insights from a well-phenotyped isolated population. Nature, 613, 508-518. https://doi.org/10.1038/s41586-022-05473-8
- Ge, T., Chen, C. Y., Ni, Y., et al. (2019). Polygenic prediction via Bayesian regression and continuous shrinkage priors. Nat Commun, 10, 1776. https://doi.org/10.1038/s41467-019-09718-5
- Privé, F., Vilhjálmsson, B. J., Aschard, H., & Blum, M. G. B. (2019). Making the Most of Clumping and Thresholding for Polygenic Scores. American Journal of Human Genetics, https://doi.org/10.1016/j.ajhg.2019.11.001
- Abdellaoui, A., Smit, D. J. A., van den Brink, W., Denys, D., & Verweij, K. J. H. (2021, March 1). Genomic relationships across psychiatric disorders including substance use disorders. Drug and Alcohol Dependence, 220, 108535. https://doi.org/10.1016/j.drugalcdep.2021.108535
- Christophersen, I. E., Rienstra, M., Roselli, C., Yin, X., Geelhoed, B., Barnard, J., ... Guo, X.; METASTROKE Consortium of the ISGC; Neurology Working Group of the CHARGE Consortium; Dichgans, M., Ingelsson, E., Kooperberg, C., Melander, O., Loos, R. J. F., Laurikka, J., ... Ellinor, P. T.; AFGen Consortium. (2017, June). Large-scale analyses of common and rare variants identify 12 new loci associated with atrial fibrillation. Nat Genet, 49(6), 946-952. https://doi.org/10.1038/ng.3843
- Trubetskoy, V., Pardiñas, A. F., Qi, T., Panagiotaropoulou, G., Awasthi, S., Bigdeli, T. B., ... Chung, M. K., Felix, S. B., Gudnason, V., Alonso, A., Roden, D. M., Kääb, S., Chasman, D. I., Heckbert, S. R., Benjamin, E. J., Tanaka, T., Lunetta, K. L., Lubitz, S. A., & Ellinor, P. T. (2022). Mapping genomic loci implicates genes and synaptic biology in schizophrenia. Nature, 604(7906), 502-508. https://doi.org/10.1038/s41586-022-04434-5
- Wray, N. R., Ripke, S., Mattheisen, M., et al. (2018). Genome-wide association analyses identify 44 risk variants and refine the genetic architecture of major depression. Nat Genet, 50, 668-681. https://doi.org/10.1038/s41588-018-0090-3
- Nikpay, M., Goel, A., Won, H. H., Hall, L. M., Willenborg, C., Kanoni, S., ... Farrall, M. (2015, October). A comprehensive 1,000 Genomes-based genome-wide association meta-analysis of coronary artery disease. Nat Genet, 47(10), 1121-1130. https://doi.org/10.1038/ng.3396
- Michailidou, K., Lindström, S., Dennis, J., Beesley, J., Hui, S., Kar, S., ... Easton, D. F. (2017). Association analysis identifies 65 new breast cancer risk loci. Nature, 551(7678), 92-94. https://doi.org/10.1038/nature24284
- Scott, R. A., Scott, L. J., Mägi, R., Marullo, L., Gaulton, K. J., Kaakinen, M., ... McCarthy, M. I.; DIAbetes Genetics Replication And Meta-analysis (DIAGRAM) Consortium. (2017, November). An Expanded Genome-Wide Association Study of Type 2 Diabetes in Europeans. Diabetes, 66(11), 2888-2902. https://doi.org/10.2337/db16-1253
- Stahl, E. A., Breen, G., Forstner, A. J., et al. (2019). Genome-wide association study identifies 30 loci associated with bipolar disorder. Nat Genet, 51, 793-803. https://doi.org/10.1038/s41588-019-0397-8
Orchid Health supports open research data initiatives while abiding by the terms of use on all genetic risk models and datasets. PGC data was used in this study for the evaluation of the potential of multi-PGS model training technique only in a research context.
Supplementary Tables
Supplementary Table A: How each disease case is defined in evaluating genetic risk scores in the UK Biobank
- Class III Obesity was defined as having a BMI (UK Biobank Field 21001) of 40 kg/m2 or above.
- The depression phenotype was defined for participants who participated in the Mental Health Survey who had researcher-derived “probable recurrent depression (severe)”, and controls excluded participants with any depression or bipolar.
Supplementary Table B1-B10
Number of Heart Disease cases in test set: 1765 (prevalence of 5.38% in Cohort 1 overall)
Number of Breast Cancer cases in test set: 6061 (prevalence of 7.45% in Cohort 1 females overall)
Number of Schizophrenia cases in test set: 476 (prevalence of 0.27% in Cohort 1 overall)
Number of Type 2 Diabetes cases in test set: 2363 (prevalence of 6.9% in Cohort 2 overall)
Number of bipolar cases in test set: 640 (prevalence of 0.41% in Cohort 1 overall)
Number of atrial fibrillation cases in test set: 7502
Number of depression cases in test set: 2415
Number of class III obesity cases in test set: 569 (prevalence of 1.39% in Cohort 2 overall)
Acknowledgements
This research has been conducted using the UK Biobank Resource under Application Number 80545.


