Psoriasis
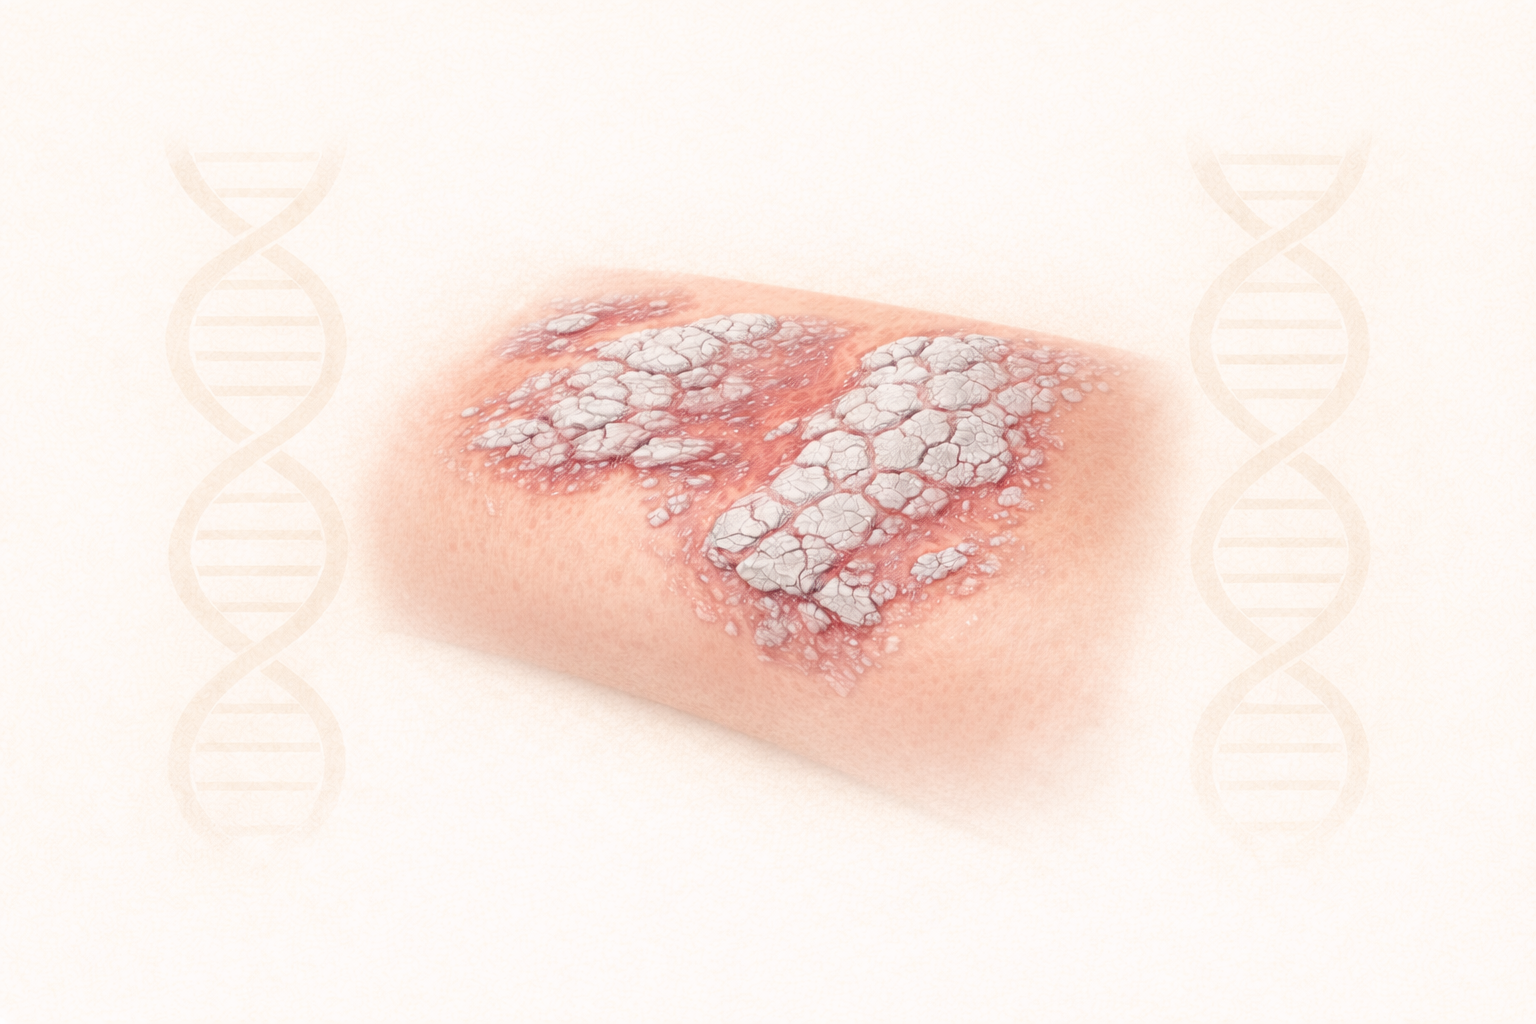
Psoriasis is an inflammatory disease that primarily affects the skin. The most common subtype, plaque psoriasis, accounts for up to 90% of cases and presents as red, scaly skin lesions with silvery scale. Other forms include guttate, pustular, and erythrodermic psoriasis. Up to 30% of individuals with psoriasis also develop psoriatic arthritis, and psoriasis is associated with an increased risk of cardiovascular disease, metabolic syndrome, and psychiatric conditions, though the underlying connections are not fully understood. Viral infections are a common trigger for psoriasis flares.[1]
Genetic Risk Score
Psoriasis is shaped by both environmental and genetic factors. Some rare variants in genes such as IL36RN are strongly associated with certain subtypes of psoriasis,[1] but most cases arise from the combined effects of many genetic variants and environmental exposures. Genetic risk scores (GRS), which combine the small effects of many variants into a single score, are currently the only way to estimate genetic risk. Although not diagnostic, a GRS can indicate how likely an individual is to develop the disease.
Orchid’s psoriasis GRS was trained following current industry standards.[2][3] The GRS was constructed using the SBayesRC algorithm trained on publicly available FinnGen and Million Veterans Program summary statistics.[4][5] The summary statistics include 32,555 cases and 1,085,410 controls.[6] The resulting GRS contains over a million variants.
Risk predictions are adjusted to each individual’s ancestry, with predictive power decaying as genetic distance from the predominately European training data increases.[7] Orchid considers a GRS meaningfully predictive if individuals at roughly the 97.7th percentile have an odds ratio (OR) of 2. The Psoriasis GRS meets this criteria for all common ancestry groups.
Clinical Impact and Prevalence
Psoriasis affects approximately 3% of U.S. adults.[8] Treatment focuses on reducing inflammation, controlling symptoms, and preventing flares, with options ranging from topical treatments for mild disease to light-based therapies and systemic treatments for more severe cases. Lifestyle measures and trigger management are also important, and treatment is usually tailored to disease severity and impact on quality of life.[1]
Performant Risk Stratification
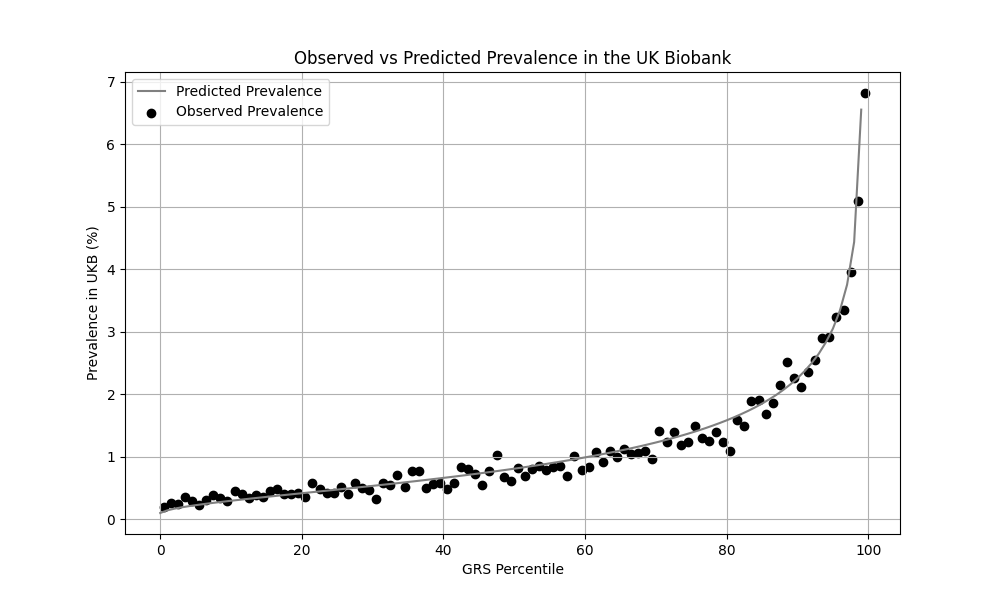
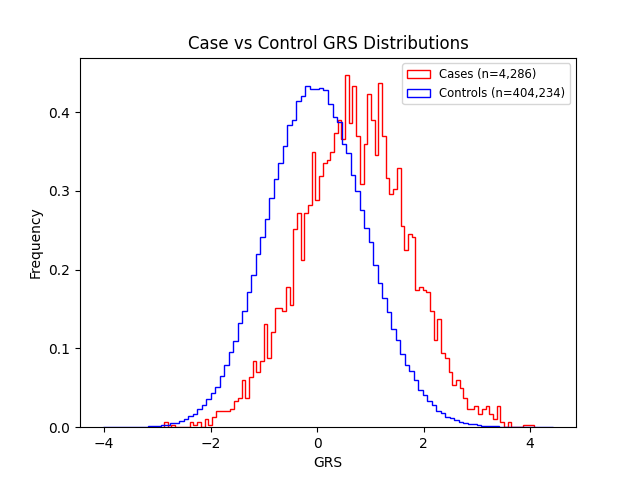
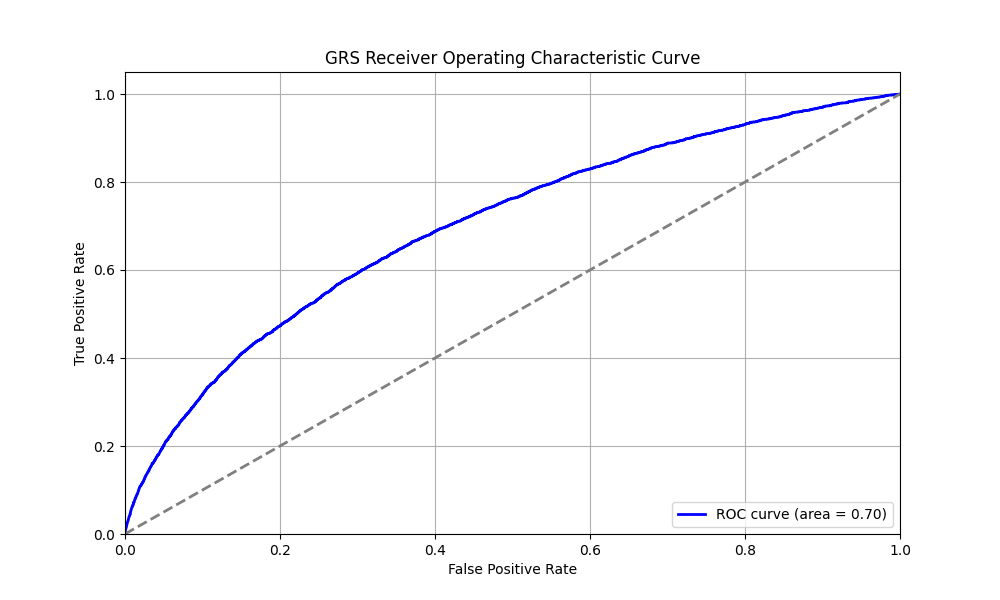
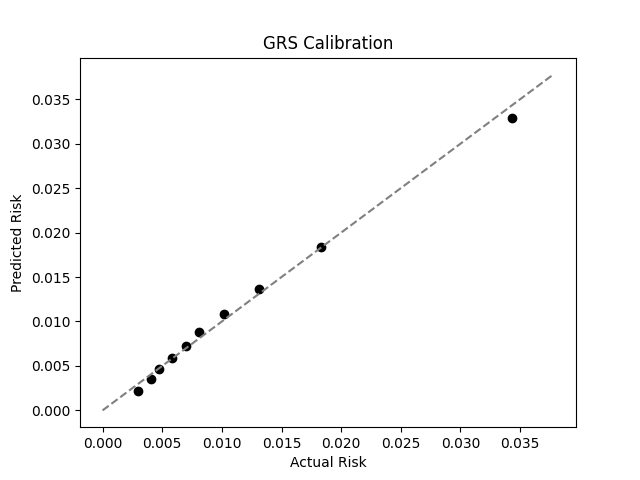
We evaluated the predictive performance of Orchid’s psoriasis GRS using the UK Biobank (UKB), a research database of roughly 500,000 genotyped individuals from the United Kingdom. We restricted the analysis to participants of British ancestry and defined psoriasis using the L40.x ICD-10 code, yielding 4,286 cases and 404,234 controls (1.0% prevalence). We then grouped individuals by GRS percentile and compared the observed disease prevalence within each group to our model’s predictions (Figure 1). For additional technical details, see the Supplementary Data.
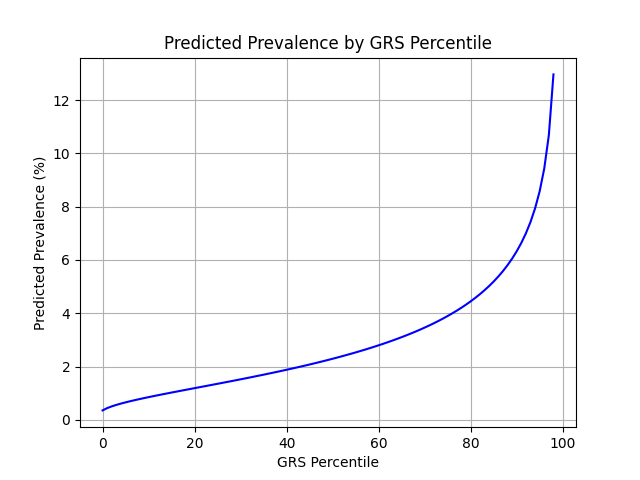
UKB participants tend to be healthier than the general population, which leads to lower observed disease prevalence.[9] The National Psoriasis Foundation estimates a 3.0% prevalence of psoriasis, much higher than the prevalence in the UKB.[8] We adjust our model so that its average predicted risk aligns with this estimate (see Figure 2).[10] People at the tail end of the GRS distribution were at an elevated risk compared to the mean (see Table 3), with adults in the 99th percentile 4.3x more likely to develop psoriasis than average (13.0% vs 3.0%).
References
1. Armstrong AW, Blauvelt A, Callis Duffin K, et al. Psoriasis. Nat Rev Dis Primers. 2025;11:45. doi:10.1038/s41572-025-00630-5.
2. Moore S, Davidson I, Anomaly J, et al. Development and validation of polygenic scores for within-family prediction of disease risks. medRxiv. 2025. doi:10.1101/2025.08.06.25333145.
3. Cordogan S, Starr DB, Treff NR, et al. Within- and between-family validation of nine polygenic risk scores developed in 1.5 million individuals: implications for IVF, embryo selection, and reduction in lifetime disease risk. medRxiv. 2025. doi:10.1101/2025.10.24.25338613.
4. Zheng, Z., Liu, S., Sidorenko, J. et al. Leveraging functional genomic annotations and genome coverage to improve polygenic prediction of complex traits within and between ancestries. Nat Genet 56, 767–777 (2024). https://doi.org/10.1038/s41588-024-01704-y
5. FinnGen. FinnGen+MVP+UKBB Summary Statistics. Available at: https://mvp-ukbb.finngen.fi/about. Accessed 2025-12-05.
6. FinnGen. FinnGen+MVP+UKBB Phenotypes. Available at: https://mvp-ukbb.finngen.fi. Accessed 2025-12-15.
7. Privé, Florian et al. “Portability of 245 polygenic scores when derived from the UK Biobank and applied to 9 ancestry groups from the same cohort.” American journal of human genetics vol. 109,1 (2022): 12-23. doi:10.1016/j.ajhg.2021.11.008
8. National Psoriasis Foundation. Prevalence of Psoriasis. Available at: https://www.psoriasis.org/prevalence-of-psoriasis/ Accessed: 2025-12-16
9. Fry A, Littlejohns TJ, Sudlow C, et al. Comparison of sociodemographic and health-related characteristics of UK Biobank participants with those of the general population. Am J Epidemiol. 2017;186:1026–1034. doi:10.1093/aje/kwx246.
10. Chatterjee N, Shi J, García-Closas M et al. Developing and evaluating polygenic risk prediction models for stratified disease prevention. Nat Rev Genet. 2016;17:392–406. doi:10.1038/nrg.2016.27
Supplementary Figures
Acknowledgements
This research has been conducted using the UK Biobank Resource under Application Number 80545.


