

Overview
Research has shown that polygenic risk scores integrated with parental phenotypes improves prediction[1]. These prediction frameworks typically use a latent liability threshold model that allows for the incorporation of complex family histories (e.g. second degree relatives or multiple family members)[2]. In this note, we use this same framework to estimate the lifetime prevalence of a disease for people with an affected first degree relative. In our simulations, the odds ratios for people with a first-degree relative affected compared to those without range from 2 to 8, and the numbers are highest for rare diseases with high heritabilities. We then show that these simulations match empirical data by comparing them to the odds ratios for cohorts with positive family history in the UK Biobank, which has a rich set of self-reported family history data. Finally, we use empirical data and simulations to show that for families using Genomic Risk Scores (GRS) to prioritize embryos for implantation, the absolute risk reduction is much higher for families with a history of disease.
Theoretical Model and Biobank Data
We use a well-known framework that decomposes a latent liability into the sum of two terms, representing the contribution from genetics and environment:
l = g + e
The genetic term g is normally distributed with variance equal to the heritability h2 of the disease, and the term e is independently distributed with variance 1-h2, so that the sum l has variance 1. People whose latent liability l exceeds a threshold t are modeled as having the disease, where the threshold t is calibrated to match the baseline prevalence of the disease.
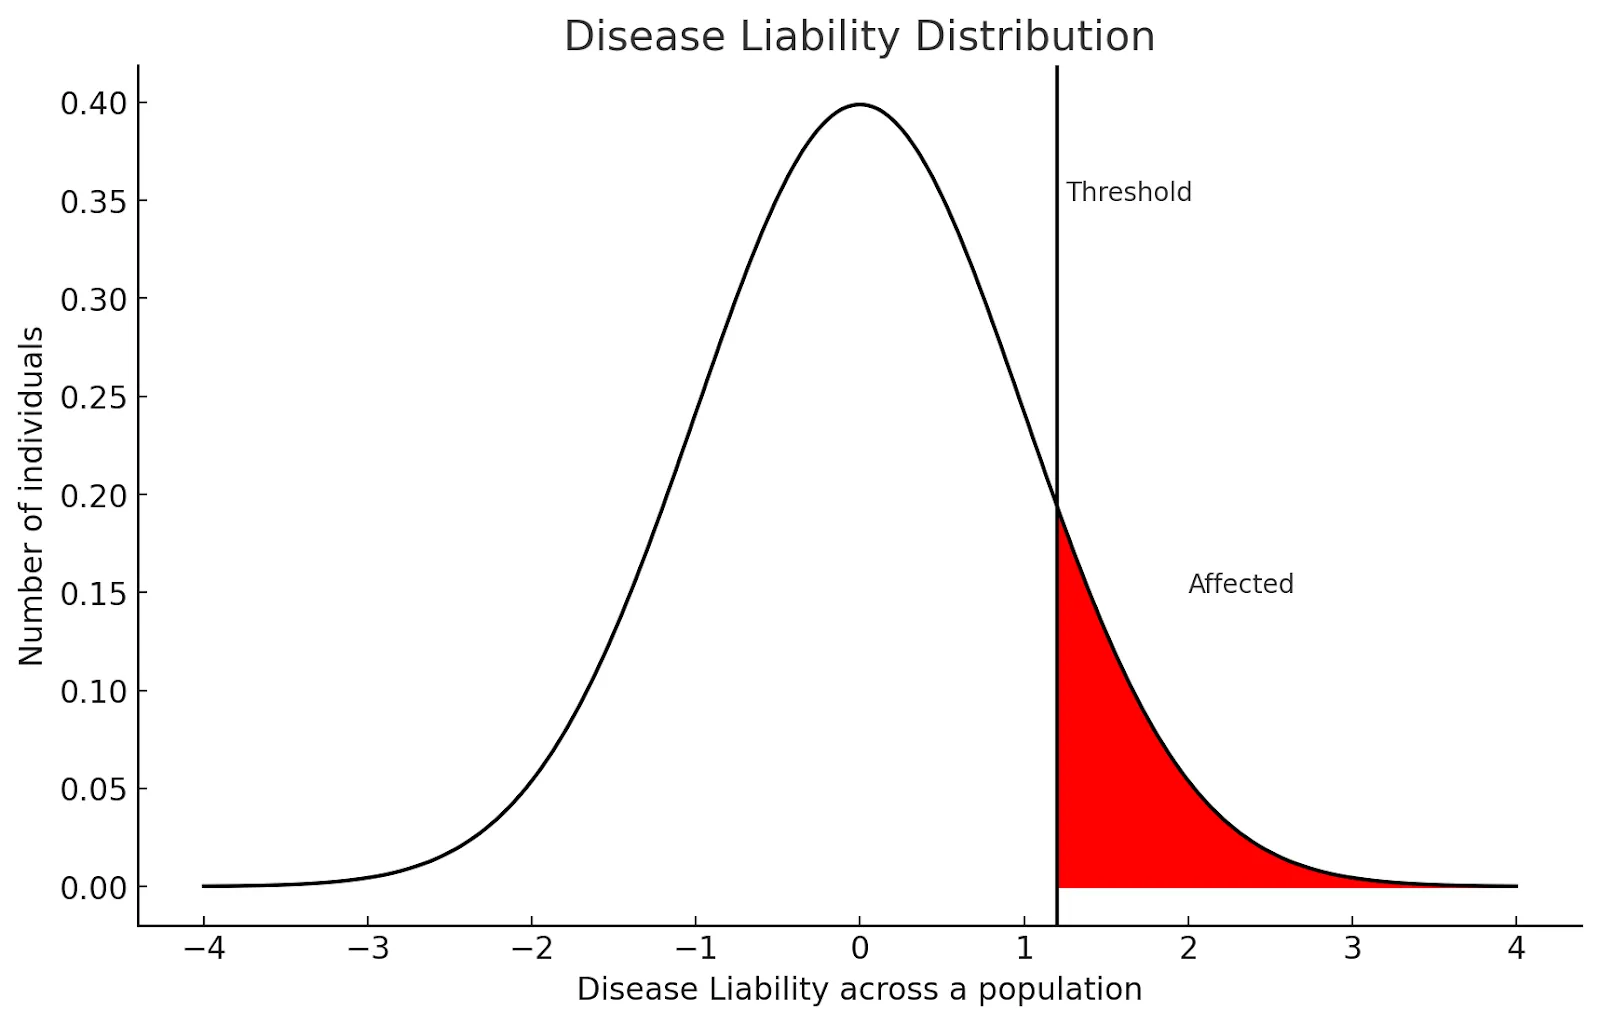
Figure 1: Individuals whose latent liability l exceed threshold t = 1.2 are modeled as having the disease, while those with liability t < 1.2 are controls.
In the UK Biobank (UKBB), participants are asked to self-report whether their mother or father suffered from a set of 11 diseases, and of these we examine the 4 most common polygenic diseases that are also in Orchid’s disease panel: type 2 diabetes, heart disease, prostate cancer, and breast cancer. To avoid ancestry confounding, we considered White British samples, and we also excluded all samples who selected “Do not know” or “Prefer not to answer” for each disease.
Family History Relative Risk Using Self-Reported Data in the UK Biobank
For each disease, we construct a model of the disease status for a given individual (referred to as 'sample i') using logistic regression:
logit(pi) = β0 + β1*any_parenti + β2*sexi + β3*agei
In this model, pi represents the probability that sample i has the disease. The variable any_parenti is a binary indicator denoting whether either of the sample i's parents had the disease. The variable sexi is a binary indicator for the sex of sample i, and agei represents the age of sample i. For breast cancer and prostate cancer, the dummy variable for sex was removed since only female and male samples were considered, respectively.
For the simulations, we need to specify the heritability (i.e.h2 in the model) and baseline prevalence (which corresponds to t in the model). The heritability was calculated from external studies with family data, while the baseline prevalences for child, mother, and father were matched to those in the UK Biobank data. Risk ratios were calculated by computing the proportion of families where a parent and child had the disease divided by the portion where just the child had the disease.
For the UK Biobank data, relative risk ratios were computed by exponentiating the any_parent regression coefficient and converting to a risk ratio scale using the formula
Relative Ratio = Odds Ratio / (1 - p + p x Odds Ratio)
where p is the lifetime prevalence of the disease for those without a family history.
For heart disease and prostate cancer, the simulated risk ratios were higher than the empirically estimated risk ratio; this may be due to the fact that the genetic correlation between the disease and self-reported family history of the disease is less than one. This may indicate the parent of a UKBB participant suffered from undiagnosed disease or a participant was not aware of a parent’s disease.
Extrapolated Lifetime Risks Using Self-Reported Data in the UK Biobank
For convenience, we have extrapolated the results from the regression coefficients in the self-reported UK Biobank data to a lifetime risk calculated rather than the prevalence within the UK Biobank.
Rare Diseases Without UK Biobank Self-Report Data
For many of the diseases in Orchid’s panel there is no self-reported family history recorded in the UK Biobank, so we report a sibling recurrence risk ratio (defined as the probability of having the disease conditional on a sibling having it divided by the general population risk). Confidence intervals are the ones reported in the external data.
For our simulation data, we use a two sibling liability threshold model, where the narrow sense heritability and base lifetime risk come from external sources. We compute the first-degree relative risk ratio as the probability of having the disease conditional on a sibling having it divided by the probability of having the disease, which is slightly higher than the recurrence ratio defined above.
On some diseases (Type 1 Diabetes and Celiac disease) our simulated results diverge from external estimates (likely because the latent liability model did not capture oligogenic inheritance patterns[8][9]). Below we do not simulate how embryo prioritization affected these diseases.
Risk Reduction Using Embryo Prioritization: Empirical and Simulated Data
Polygenic preimplantation genetic testing (PGT-P) allows a couple to prioritize embryos for implantation based on Genomic Risk Scores (GRS), preferentially selecting embryos at lower risk of a disease. UK Biobank sibling pairs allow us to directly model the effect of embryo prioritization when 2 embryos are available, and using a latent liability model we can model the effect of prioritization when 5+ embryos are available.
Empirical Data
The UK Biobank contains 18,176 sibling pairs of self-identified White British ancestry. For common diseases, this data allows us to directly examine the stratification in risk within families to demonstrate that lower GRS siblings have reduced risk for disease.
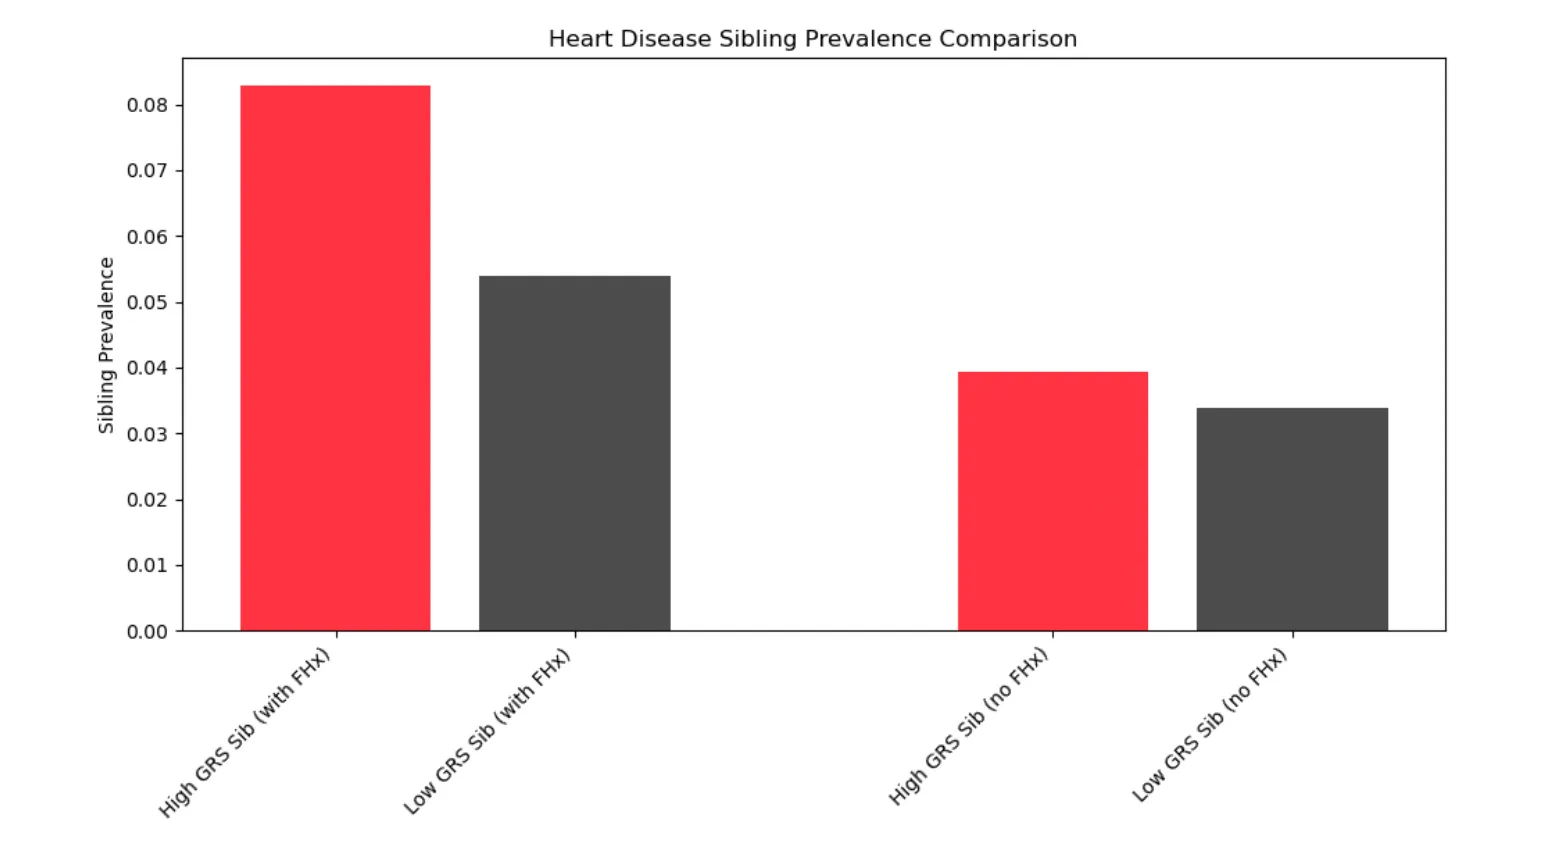
Figure 2: In pairs of siblings with a self-reported parent history of heart disease, the lower GRS sibling is 35% less likely to get heart disease (5.4% vs 8.3%).
In the context of embryo prioritization, this indicates that the absolute reduction in heart disease risk achieved by embryo prioritization is larger in a family with a disease history than one without.
Simulations of Absolute and Relative Risk Reduction
A healthy couple undergoing IVF may have 5 or more viable embryos available for implantation. However, the UK Biobank contains a limited number of sibling pairs and extremely few families with 5+ siblings; this restricts an empirical analysis on sibling pairs to very common diseases and makes it impossible to directly measure the impact of embryo prioritization.
However, using the liability threshold model to simulate families with disease statuses[3], we can calculate the risk reduction achieved by prioritizing an embryo (the embryo with the lowest GRS, given 5 viable embryos) with and without history status (FHx). To do so, we simulate 100,000,000 families consisting of 5 children, parents, and grandparents and 2 aunts/uncles, all given simulated disease liabilities and therefore disease status. A second degree family history is defined as one or more grandparents or an aunt/uncle with the disease, while a first degree relative is defined as a parent or sibling.
We split the diseases into two categories: late onset and early onset:
- For late onset diseases (heart disease, breast cancer, prostate cancer, atrial fibrillation, and type 2 diabetes), we only condition on an affected grandparent, since we do not expect parents undergoing IVF to be old enough to have developed these diseases.
- For early onset diseases, however, we give figures for both first degree family history (an affected parent) and second degree family history.
We compare the resulting disease risk for selected embryos in each of 4 scenarios — for families with vs without a history of disease, and selecting embryos without regard to GRS (“random”) vs choosing the embryo with the lowest GRS of the 5.
Late Onset Diseases
Absolute Reduction
For all diseases, the absolute risk reduction achieved by embryo prioritization is higher when a family brings a history of disease than when a family has no disease history.
Relative Reduction
Early Onset Diseases
Even though the risk of a child suffering from these rare diseases is greatly magnified when a first-degree relative suffers from the same disease, prioritizing embryos with low GRS significantly reduces the relative risk for all simulated diseases (from 23% for bipolar disorder up to 45% for IBS).
Discussion
We evaluated whether prioritizing embryos to minimize disease risk resulted in larger absolute risk reductions when a family has a history of the target disease. These findings confirm the heightened efficacy of embryo prioritization in families with a history of disease.
We first quantified that for many common diseases, a parent’s history of disease is strongly predictive of disease risk in their children. We also demonstrated that the latent liability model aligned with external sibling recurrence estimates on a panel of rare diseases without reported family history.
Using the same latent liability model we then simulated the effect of embryo prioritization on families with and without a history of disease. On all the diseases simulated, the absolute risk reduction achieved by prioritizing the embryo with the lowest GRS (of 5) was in all cases higher for families with a history of disease than those without a disease history, and this effect is especially pronounced for diseases with low baseline population frequency.
References
- Aukes, M., Laan, W., Termorshuizen, F. et al. Familial clustering of schizophrenia, bipolar disorder, and major depressive disorder. Genet Med 14, 338–341 (2012). https://doi.org/10.1016/gim.2011.16
- Hujoel, M.L.A., Loh, P.-R., Neale, B.M., Price, A.L. (2022). Incorporating family history of disease improves polygenic risk scores in diverse populations. Cell Genomics, 2(7), 100152. ISSN 2666-979X. https://doi.org/10.1016/j.xgen.2022.100152.
- Todd Lencz, Daniel Backenroth, Einat Granot-Hershkovitz, Adam Green, Kyle Gettler, Judy H Cho, Omer Weissbrod, Or ZukShai Carmi (2021). Utility of polygenic embryo screening for disease depends on the selection strategy eLife 10:e64716.https://doi.org/10.7554/eLife.64716
- Rubio-Tapia A, Van Dyke CT, Lahr BD, Zinsmeister AR, El-Youssef M, Moore SB, Bowman M, Burgart LJ, Melton LJ 3rd, Murray JA. Predictors of family risk for celiac disease: a population-based study. Clin Gastroenterol Hepatol. 2008 Sep;6(9):983-7. doi: 10.1016/j.cgh.2008.04.008. Epub 2008 Jun 30. PMID: 18585974; PMCID: PMC2830646.
- Burba, Kate. Familial incidence linked to risk for IBD in first-degree relatives. https://www.healio.com/news/gastroenterology/20220425/familial-incidence-linked-to-risk-for-ibd-in-firstdegree-relatives
- Svensson AC, Lichtenstein P, Sandin S, Öberg S, Sullivan PF, Hultman CM. Familial aggregation of schizophrenia: the moderating effect of age at onset, parental immigration, paternal age and season of birth. Scand J Public Health. 2012 Feb;40(1):43-50. doi: 10.1177/1403494811420485. Epub 2011 Sep 19. PMID: 21930618; PMCID: PMC4229243.
- Lee, S. H., M. E. Goddard, N. R. Wray and P. M. Visscher (2012). "A better coefficient of determination for genetic profile analysis." Genetic Epidemiology 36(3): 214-224
- Orchid Team. Type 1 Diabetes Whitepaper. https://guides.orchidhealth.com/post/type-1-diabetes-whitepaper
- Orchid Team. Celiac Disease Whitepaper. https://guides.orchidhealth.com/post/celiac-disease-whitepaper
Supplementary Methods and Data
Liability Threshold Model
We use the same liability threshold model as in [3] but extend the family structure to three generations (sibling embryos, parents, grandparents). In brief, we decompose the latent liability for disease into a genetic component (which covaries between relatives) and a non-genetic component (which is assumed to be independent between them).
l = g + e
The genetic g is further divided into p and u for the polygenic and unrecaptured (by the PRS) genetic portion. If the heritability of the disease is h2, then g ~ N(0, h2), p ~ N(0, rps2), u ~ N(0, h2 - rps2). We can then simulate each of these parameters for multigenerational family structures with the appropriate. For example, if we were simulating a vector representing an embryo, a father, a mother, and a paternal grandparent, the polygenic scores would be a multivariate normal distribution of mean zero and covariance given by:
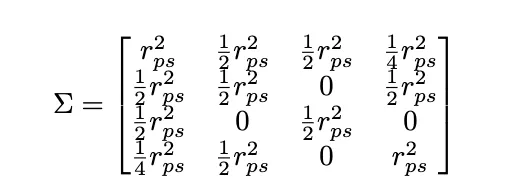
The coefficient in front of each term represents the relatedness between each pair.
Simulation Parameters
To compute the liability rps2, we use the formula in [7], which accounts for the lower prevalence of the disease in the UK Biobank compared to the lifetime prevalence of the disease in the general population. The liability rps2 for type 1 diabetes and celiac are not available since they are oligogenic diseases, so the genetic liability explained by the polygenic score is not normally distributed.
Acknowledgements
This research has been conducted using the UK Biobank Resource under Application Number 80545.
Elan Bechor is a Senior Data Scientist at Orchid working on polygenic risk score modeling. He has a PhD in Mathematics from University of California, Berkeley where he researched probability theory.


