
Orchid’s mission is to help everyone have a healthy baby. A critical component of this strategy is genetic screening of embryos created during in vitro fertilization (IVF). Orchid’s preimplantation whole genome screens, PGT-WGS and PGT-A+GRS, analyze over 99% of an embryo’s DNA compared to other tests that examine less than 1%.
PGT-WGS screens over 1200 genes simultaneously to lower the risk for neurodevelopmental disorders, birth defects, and pediatric to adult onset hereditary cancers. PGT-WGS combines PGT-A, PGT-SR, PGT-P, and PGT-M into a single screen which can identify multiple pathogenic variants without additional probe design and without previous parental screening. Click here to learn more about the hundreds of diseases PGT-WGS screens for.
Both PGT-WGS and PGT-A+GRS determine an embryo’s genetic predisposition to the following chronic diseases using genetic risk scores:
Neurological health:
Cardiovascular health:
Cancer:
General health:
With this information, prospective parents and their clinical team can learn about the embryos’ chances for developing each disease and prioritize embryos for implantation accordingly. In the event that an embryo with a higher risk is chosen, knowing about that risk can help parents prepare. For example, knowing a future child might be at higher risk for type 2 diabetes means being extra vigilant in terms of diet, exercise, and, after discussion with their doctor, perhaps additional screening.
Because genetic risk scores are a relatively new technology, Orchid receives a lot of questions about what they are and how well they work to predict disease. We answer the most common questions we get below. We first provide brief answers to each question and then go into more detail later.
What is a genetic risk score?
Most diseases have a genetic component. Genetic risk scores quantify the degree of risk conferred through an individual’s genes. Genetic risk scores are usually made up of anywhere from tens of thousands to over one million single nucleotide polymorphisms (SNPs), each of which has an effect on the risk of developing a particular disease.
How well validated are genetic risk scores?
The evidence supporting genetic risk scores is based on curated databases of hundreds of thousands of individuals’ genetic sequencing data paired with physician verified diagnoses. Large-scale studies have reproducibly found that genetic risk score percentile stratifies and predicts the fraction of individuals that develop a disease over time. In some cases, genetic risk scores can be more predictive of disease than single clinical factors like obesity, smoking, or high cholesterol.
How accurately can Orchid read embryo DNA?
Our whole-genome sequencing technology allows us to reliably detect millions of single nucleotide polymorphisms in an embryo’s genome. We confirmed this in our validation by testing the same embryo 3 times and achieving extremely similar genomic coverage and resulting genetic risk scores.
How much can prioritizing an embryo with a lower genetic risk score reduce the risk for disease?
Prioritizing a lower risk embryo can result in significant reductions in both relative and absolute risk. For example, absolute risk for breast cancer can be reduced from 40% to the typical 12% when one embryo is in the 97th percentile of risk and remaining embryos have typical risk. Significant reduction can be achieved even if no embryos are in the high risk category. For example, it is possible to lower the relative risk for developing schizophrenia by 38% by prioritizing the lowest risk embryo out of 3.
Can Orchid’s genetic risk scores identify embryos that will be more likely to develop disease later in life?
We show that siblings with a high genetic risk score for breast cancer develop breast cancer 3x more often than siblings with a lower genetic risk score. Since genetic risk scores can identify adult siblings more likely to develop a disease, it makes sense they can do the same with embryos because embryos are siblings.
Can Orchid’s genetic risk scores predict disease risk in non-Europeans?
Orchid’s genetic risk scores can identify people of non-European descent who have a higher chance of developing a disease using genetic risk scores even with the strict accuracy requirement that the odds ratio of developing that disease are at least twice as high for individuals above the 97th genetic risk score percentile.
Will Orchid's genetic risk scores select against specific ancestries?
We have adjusted our genetic risk scores so that ancestry does not correlate with genetic risk scores. Unadjusted genetic risk scores for a disease may correlate with ancestry because of the bias introduced due to the underrepresentation of non-Europeans in large-scale genetic datasets. Using unadjusted genetic risk scores to lower risk for a disease could inadvertently select against a specific ancestry.
Will reducing genetic risk for one condition come at the cost of increased genetic risk for another condition?
Having a lower genetic risk score for one disease often lowers the risk for other related diseases. However, occasionally a lower risk for one disease can mean a higher risk for a second disease. We clearly spell out cases where this happens and for the most part, these cases are not common and have only a small effect.
More detailed answers to each of these questions can be found below.
1. What is a genetic risk score?
Summary: Most diseases have a genetic component. Genetic risk scores quantify the degree of risk conferred through an individual’s genes. Genetic risk scores are usually made up of anywhere from tens of thousands to over one million single nucleotide polymorphisms (SNPs), each of which has an effect on the risk of developing a particular disease.
The human genome contains millions of genetic markers that commonly vary across individuals and influence the risk of common diseases. Individually, each of these associated single nucleotide polymorphisms (SNPs) has a small impact on disease risk. Their combined effect, calculated as a genetic risk score (GRS), is frequently the best genetic estimate of disease risk, providing more predictive value than any single gene marker alone [1,2,3].
Over the last 5 years, as genome sequencing has become more affordable, study sizes have grown to hundreds of thousands of individuals. These larger study sizes provided large amounts of data and afforded the development of more accurate genetic risk scores [4,5].
The table below outlines the twelve chronic diseases that Orchid provides genetic risk scores for by category and includes key statistics for the genetic risk score for each disease.

Orchid’s genetic risk scores are based on studies with large numbers of participants ranging from 15,078 to 339,224 individuals. Genetic risk scores require large numbers of study participants to yield meaningful results which is why Orchid will only provide genetic risk scores that are based on studies that include at least 10,000 people.
Genetic risk scores are reported by how much more likely an individual is to get a disease compared to other people. So if someone is in the 97th percentile of risk, they are more likely to develop a disease than 97% of the population. Orchid will only provide results if people in the 97th percentile risk group are at least twice as likely to develop the disease.
The odds ratios for the diseases Orchid reports on range from 2.4 to 17.5 for people of European descent in the 97th percentile of risk (see our question on ancestry for how they perform for other groups). These numbers are comparable to certain current genetic tests that identify single variants for risk and in some cases outperform traditional clinical risk factors like smoking, body mass index (BMI), and family history [3,6].
2. How well validated are genetic risk scores?
Summary: The evidence supporting genetic risk scores is based on curated databases of hundreds of thousands of individuals’ genetic sequencing data paired with physician verified diagnoses. Large-scale studies have reproducibly found that genetic risk score percentile stratifies and predicts the fraction of individuals that develop a disease over time. In some cases, genetic risk scores can be more predictive of disease than single clinical factors like obesity, smoking, or high cholesterol.
Large scale studies have shown that people with high genetic risk scores develop disease more often than people with lower genetic risk scores.
As just one example, the figure below maps the percentile of Orchid’s genetic risk score for coronary artery disease (CAD) to the prevalence of CAD in the UK Biobank. The blue dots represent actual patient cases with a given genetic risk score, while the black dots represent the predicted prevalence using Orchid’s CAD genetic risk score.

There is a close correlation between disease prevalence and predicted risk from Orchid’s genetic risk scores. In other words, people with a higher genetic risk score for CAD develop CAD more often.
Graphs showing similar correlations between genetic risk score and patients with disease for the remainder of diseases can be found in our whitepapers.
Genetic risk scores can be more predictive of risk than many single common clinical risk factors. As an example, a recent study [6] found that a genetic risk score for CAD was more predictive of risk than any of the following risk factors alone: smoking, diabetes, family history of heart disease, body mass index (BMI), hypertension, and high cholesterol. In addition, adding the CAD genetic risk score to the other risk factors increased their predictive value further.
A second study [7] showed that individuals with a BMI of 30 were twice as likely to develop CAD. Orchid’s genetic risk score can identify people at higher risk than that. An individual in the 97th percentile of risk for developing CAD is 2.4 times more likely to develop CAD and if they are in the 99th percentile, the number goes up to 2.8.
3. How accurately can Orchid read embryo DNA?
Summary: Our whole-genome sequencing technology allows us to reliably detect millions of single nucleotide polymorphisms in an embryo’s genome. We confirmed this in our validation by testing the same embryo 3 times and achieving extremely similar genomic coverage and resulting genetic risk scores.
In a CLIA lab setting (CLIA ID: 34D2260214), we observed an average of 99.6% genomic coverage, 99.9% accuracy, 99.9% specificity, 98.0% precision, and 98.1% sensitivity using the whole embryo as the reference [8]. Below are the results for four different genetic risk scores generated from two different biopsies and one inner cell mass (ICM) sample from the same embryo. We performed this experiment with 14 unique embryos.

Genetic risk scores are consistent across the three replicates with a variability across replicates from the same sample of typically less than 5 percentile points. Our scores are only minimally affected by coverage differences across replicates and by errors in sequencing the DNA (genotyping errors).
4. How much can prioritizing an embryo with a lower genetic risk score reduce the risk for disease?
Summary: Prioritizing a lower risk embryo can result in significant reductions in both relative and absolute risk. For example, absolute risk for breast cancer can be reduced from 40% to the typical 12% when one embryo is in the 97th percentile of risk and remaining embryos have typical risk. Significant reduction can be achieved even if no embryos are in the high risk category. For example, it is possible to lower the relative risk for developing schizophrenia by 38% by prioritizing the lowest risk embryo out of 3.
Prioritizing a lower risk embryo can result in significant reductions in both relative and absolute risk. How much risk reduction depends on a number of factors including the range of genetic risk scores the embryos have, how many embryos are available for screening, whether the disease runs in a family, and the disease itself.
Broadly speaking, there are two scenarios. In the first, one embryo is at a significantly higher risk compared to the others. In these cases, prioritizing a lower risk embryo can reduce risk significantly. For example, it is possible to reduce a future child’s chances for prostate cancer from 50% to the typical 12% [prostate cancer whitepaper] and for type 1 diabetes from 1.8% to 0.1% [t1d white paper].
In the second scenario, a set of embryos has a range of genetic risk scores but none are in the high risk category. Even in these cases it is possible to lower risk significantly by prioritizing the lowest risk embryo.
According to a recent study [9], it is possible to reduce the relative risk for schizophrenia and Crohn’s disease by up to 45% even if none of the embryos qualify as “high risk.” Reduction of around 38% is possible for three embryos and 25% for two. The data is shown below:

In this study, the authors simulate embryos from random pairs of people and determine genetic risk scores for each simulated embryo. They then compare the difference in risk between the lowest genetic risk score and from a random embryo within that set of embryos.
From the graph you can see that the relative risk is reduced sharply up to 5 embryos after which there is little additional reduction. It is important to note that significant reduction can be achieved with just two embryos.
While absolute risk reduction will be low with less common diseases, it can still be significant if a disease runs in the family. For example, around 0.5% of people have schizophrenia. Reducing that risk by even 50% means that the absolute risk falls from 0.5% to 0.25%.
5. Can Orchid’s genetic risk scores identify embryos who will be more likely to develop disease later in life?
Summary: We show that siblings with a high genetic risk score for breast cancer develop breast cancer 3x more often than siblings with a lower genetic risk score. Since genetic risk scores can identify adult siblings more likely to develop a disease, it makes sense they can do the same with embryos because embryos are siblings.
We’ve found in datasets of adult siblings that genetic risk scores can distinguish the sibling who is more likely to develop disease from those who are less likely. Since genetic risk scores can identify adult siblings more likely to develop a disease, it makes sense they can do the same with embryos because embryos are siblings.
Below are two examples using our breast cancer genetic risk score. In these studies we determined what a typical difference in genetic risk scores would be between the lowest and the highest breast cancer genetic risk scores among five embryos. Five was chosen because that is a typical number of embryos available for screening with in vitro fertilization (IVF). We then identified all such pairs in the UK Biobank and ran the following two analyses:
Analysis 1: Nearly three times as many high risk sisters developed breast cancer
In the first analysis, we looked amongst pairs of sisters where:
- one sister had the higher breast cancer genetic risk score
- one sister had the lower breast cancer genetic risk score
- one of the sisters developed breast cancer
We found 170 pairs of sisters where this was the case. The numbers of sisters in each group who developed breast cancer are graphed below:

If the genetic risk scores weren’t predictive, around 85 of each risk group would develop breast cancer. Instead, 127 sisters with the higher genetic risk score developed breast cancer while only 43 sisters with the lower genetic risk score did. Around one third of the lower risk sisters developed breast cancer compared to the higher risk sisters.
Analysis 2: Higher risk sisters are 2.5 times more likely to develop breast cancer
In the second analysis, we calculated the percent of sisters who developed cancer at various ages for:
- sisters with the higher genetic risk score
- sisters with the lower genetic risk score
- sisters where the genetic risk score was not taken into account (“random siblings”)
The data are graphed below:

Around 15% of the sisters with the higher genetic risk score developed breast cancer by age 84 compared to only 6% of the sisters with the lowest genetic risk score. In addition, the sisters with the lowest genetic risk score developed breast cancer less often than the sisters for whom genetic risk scores were not taken into account (which mirrors untested embryos).
In an IVF setting where only some embryos will be implanted, genetic risk scores can provide valuable information that can be useful to prospective parents in deciding which embryo(s) to implant. In other words, genetic screening of embryos using genetic risk scores can provide a better outcome than not screening, when the embryo implanted is chosen at random.
These analyses are consistent with what others have found when using genetic risk scores between siblings [10,11].
Additional details can be found in our sibling attenuation guide.
6. Can Orchid’s genetic risk scores predict disease risk in non-Europeans?
Summary: Orchid’s genetic risk scores can identify people of non-European descent who have a higher chance of developing a disease using genetic risk scores even with the strict accuracy requirement that the odds ratio of developing that disease are at least twice as high for individuals above the 97th genetic risk score percentile.
Many of the models behind genetic risk scores are more accurate in Europeans than in people of other genetic backgrounds because non-Europeans are underrepresented in large-scale genetic studies.
A recent study [12] showed how well genetic risk scores, averaged across 245 traits, performed in four different populations. If a European population is set at 100%, then genetic scores work 80% as well in South Asian populations, 70% as well in East Asian populations, and 44% as well for African populations.
We are committed to providing accurate genetic risk scores to people of all ancestries, with the caveat that some disease predictions are less precise in people of non-European ancestry.
For most diseases, we independently verify odds ratios in people of European descent. However, we are not always able to verify what these odds ratios are in other populations, because they are underrepresented in genetic datasets, including in the ones we use.
The result is that the necessary data doesn’t exist for each disease and each ancestry group. However, the accuracy of genetic risk scores in people of non-European ancestry is directly related to the Euclidean distance in principal component space [12]. Knowing this allows us to determine whether a genetic risk model can be expected to meet our accuracy requirements in a specific population.
The following table summarizes which of our models meet our threshold of an expected odds ratio of 2 or more at the 97th percentile risk score percentile for each disease in people of European, South Asian, East Asian descent, and African descent.
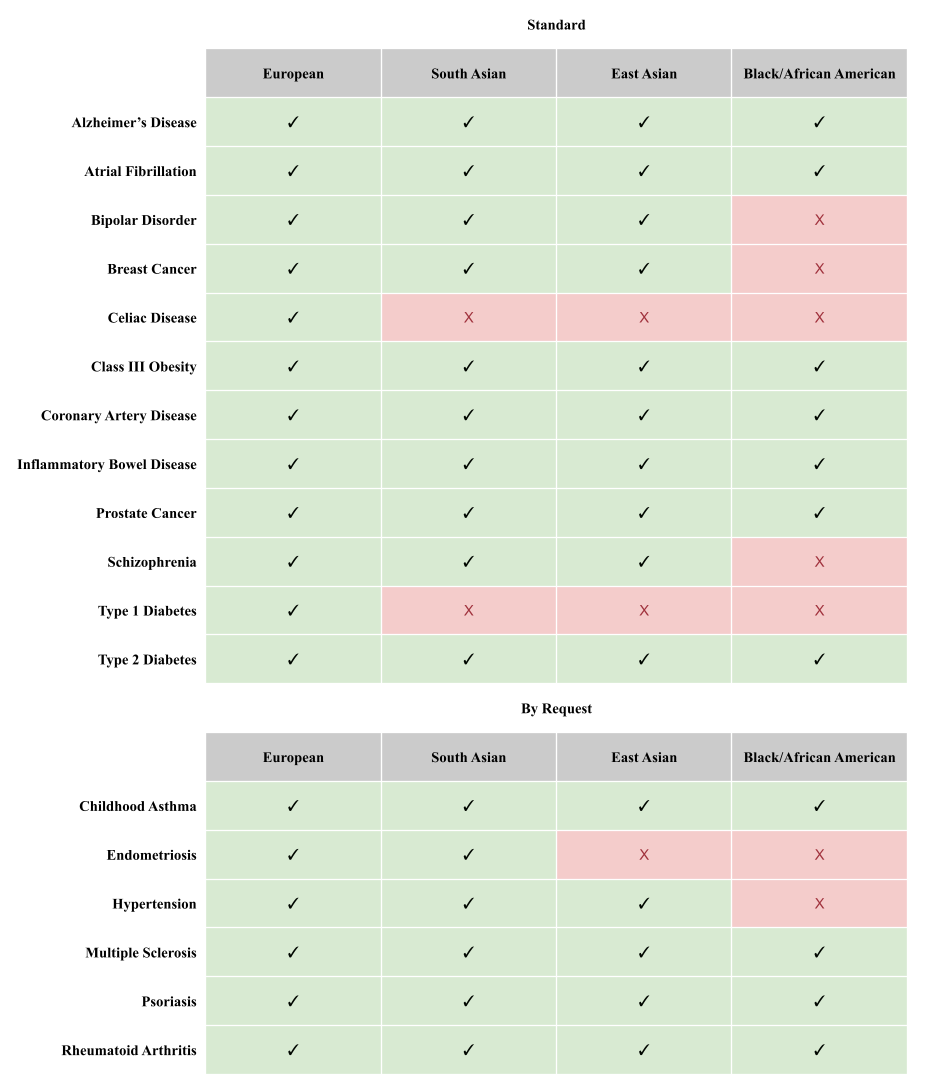
Orchid is able to provide reports to everyone to varying degrees. People of European descent receive twelve reports, people of South Asian descent receive ten, people of East Asian descent receive nine, and people of African descent receive two.
Many people do not fit neatly into one of the four categories outlined in Table 1. That is why we use a technique called principal component analysis (PCA) to measure each person’s ancestry precisely so that we can generate the appropriate genetic risk scores for them. After adjusting for their unique ancestry, we make sure to only deliver a report for a given disease if the odds of developing that disease are at least twice as high for individuals above the 97th genetic risk score percentile.
We also take additional steps to ensure that people of non-European descent receive the most accurate and appropriate results from genetic risk scores possible.
- We use genetic risk scoring methods that are specifically designed to improve accuracy across different ancestries for each disease and ancestry group [13,14]. Because of this, we can be confident that our results are at least as accurate as the state-of-the-art in each disease and ancestry group.
- We adjust each genetic risk model so that our genetic risk scores are ancestrally unbiased. Adjustments can be necessary to correct for the fact that some genetic risk models can predict that everyone from a certain population has a higher chance of developing a disease [15].
Additional details can be found in our guide on ancestry.
7. Will Orchid's genetic risk scores select against specific ancestries?
Summary: We have adjusted our genetic risk scores so that ancestry does not correlate with genetic risk scores. Unadjusted genetic risk scores for a disease may correlate with ancestry because of the bias introduced due to the underrepresentation of non-Europeans in large-scale genetic datasets. Using unadjusted genetic risk scores to lower risk for a disease could inadvertently select against a specific ancestry.
Because non-Europeans are underrepresented in the large genetic databases that genetic risk score models are based on, genetic risk scores can sometimes correlate with a specific ancestry. When this happens, selecting against developing a disease can also inadvertently select against that specific ancestry. Orchid adjusts each genetic risk score so they do not select against ancestry.
We tested our genetic risk score adjustment method on a subsample of the UK Biobank with mixed ancestry, primarily from the Caribbean but also Latin America. The set of samples used are shown below:

After scoring samples with the type 2 diabetes genetic risk score model, we applied the PCA based ancestry adjustment to generate genetic risk scores that are uncorrelated with ancestry. We then graphed the unadjusted genetic risk score against the proportion of European ancestry.

With unadjusted scores, the higher the European ancestry someone has, the lower the genetic risk score for type 2 diabetes. This highlights the importance of adjusting the genetic risk scores. If the correlation between European ancestry and risk is not valid, then the unadjusted genetic risk score would greatly overestimate the type 2 diabetes risk in people with African or Amerindian ancestry and could result in couples selecting embryos based on how much European ancestry they have instead of actual risk for type 2 diabetes.
After applying the ancestry correction method [15] for the genetic risk score, the connection between the amount of European ancestry and type 2 diabetes risk disappears.

With adjustment for ancestry, the correlation between risk and European ancestry goes from r = -0.64 to r = -0.03. In other words, there is no longer a significant association between the amount of European ancestry and type 2 diabetes risk. When a couple wishes to identify embryos with the lowest risk for developing type 2 diabetes, there will not be a bias towards higher percentage European but instead towards actual risk.
Moreover, the adjusted genetic risk scores fit a standard normal distribution, regardless of ancestry.

After adjusting for ancestry, the type 2 diabetes predictor remained highly significant. Logistic regression showed that on this sample, each standard deviation of adjusted genetic risk score was significantly associated with an increased odds ratio of 1.35 (CI: 1.20-1.51, z = 5.2) for type 2 diabetes.

For the entire sample of 1243 mixed ancestry individuals, the effect size was 37% smaller (β = 0.30 vs β = 0.48) than it was for white British, consistent with our model’s prediction of an average of 30% attenuation for these individuals.

Just over 4% of people in the lowest third (or tertile) of genetic risk scores have type 2 diabetes compared to just over 10% of people in the highest tertile. The adjusted genetic risk score for type 2 diabetes can identify people of non-European descent more likely to develop type 2 diabetes.
8. Will reducing genetic risk for one condition come at the cost of increased genetic risk for another condition?
Summary: Having a lower genetic risk score for one disease often lowers the risk for other related diseases. However, occasionally a lower risk for one disease can mean a higher risk for a second disease. We clearly spell out cases where this happens and for the most part, these cases are not common and have only a small effect.
Many genetic variants affect multiple traits at the same time. In most cases selecting against a variant that increases risk for one disease also lowers the risk for other diseases–e.g. selecting against type 2 diabetes will tend to select against obesity and heart disease as well.
But there are exceptions. Some variants increase risk for one disease, but provide protection for another. While this is not common, we place very high importance on assessing our predictions holistically, and we always highlight whenever there is reason to believe that our models might negatively affect other diseases in important ways.
For example, we generally do not recommend acting upon models with potentially complex effects on other traits, except in cases with a family history of a specific disease. Since a family history of a disease increases the absolute risk of a disease, the benefit of selecting the lowest-risk embryo in that setting is much higher.
Below is a detailed discussion of known genetic correlations between Orchid’s genetic risk scores and other diseases, diseases, and traits. To understand this section, it is important to have a good understanding of genetic correlation.
Genetic correlation: A genetic correlation is a number between -1 and 1, where a genetic correlation of 1 means that the genetic risk factors for two diseases are identical, a genetic correlation of 0 means there is no (linear) relation between the genetic risk factors for both diseases, and a genetic correlation of -1 means the genetic risk factors for two diseases do not overlap. A high positive genetic correlation between two traits means that many of the genetic variants that make you high-risk for one trait also make you high-risk for the other trait. A negative genetic correlation means that many of the genetic variants that make you high-risk for one trait make you low-risk for the other trait.
Known genetic correlations between Orchid’s genetic risk scores for each disease and other diseases, conditions, and traits:
Alzheimer’s disease
To our knowledge, no well-substantiated genetic correlations have been reported which would suggest that low risk for Alzheimer’s disease increases risk of any other diseases.
The most important variant in our Alzheimer’s predictor is the APOE-ε4 allele. One in ten people of European ancestry carries a single copy of APOE-ε4, and so have around a 3-fold increased risk of developing Alzheimer’s disease. One in a hundred people carry two copies, and those people are at a 15-fold increased risk of developing Alzheimer’s disease compared to people with no copies [16].
Positive correlations: Having an increased risk for Alzheimer’s disease because of carrying one or more copies of APOE-ε4 may also increase the risk of atherosclerosis [17]. The reports of the effects of APOE-ε4 on atherosclerosis are not as well-replicated as the reported effect on Alzheimer’s disease risk.
Negative correlations: Having an increased risk for Alzheimer’s disease because of carrying one or more copies of APOE-ε4 may be protective for early childhood infections among very disadvantaged children in a low-income country [18]. These results are unlikely to apply in a high-income population and are not as well-replicated as the reported effect on Alzheimer’s disease risk.
Atrial fibrillation
To our knowledge, no well-substantiated genetic correlations have been reported which would suggest that low risk for atrial fibrillation increases risk of any other diseases.
Positive correlations: Because atrial fibrillation is a major risk factor for cardioembolic stroke (but much less so for other subtypes of stroke), people predicted at higher risk for atrial fibrillation are also at higher risk of cardioembolic stroke [19].
Negative correlations: We searched a database of genetic correlations in the UK Biobank and filtered for significant (p-value < 0.01) negative genetic correlations between atrial fibrillation and any other traits in both biological sexes and found none.
Bipolar Disorder
People at higher risk for bipolar disorder may also be at a higher risk for schizophrenia, major depressive disorder, obsessive compulsive disorder, and attention-deficit/ hyperactivity disorder (ADHD). There are also some conflicting results around an increased risk of bipolar disorder being correlated with more years of education.
Positive correlations: People at higher risk for bipolar disorder may also be at higher risk for several other psychiatric disorders, such as schizophrenia (rG = 0.68), major depressive disorder (rG = 0.35), obsessive compulsive disorder (rG = 0.31), and ADHD (rG = 0.26) [20].
Negative correlations: People with a higher risk for bipolar disorder were more likely to have higher levels of college attainment and more years of education, but both genetic correlations were weak (rG = 0.20). This result is complicated and difficult to interpret given that the same study found no significant genetic correlation between bipolar disorder risk and intelligence. In fact, a recent study finds that the non-cognitive component of educational attainment has a positive genetic correlation with bipolar disorder, while the cognitive component of educational attainment has a negative genetic correlation with bipolar disorder [21].
Breast Cancer
To our knowledge, no significant genetic correlations have been reported which would suggest that low risk for breast cancer increases risk of any other diseases.
Positive correlations: A study from 2017 found that people at higher risk for breast cancer were also at higher risk for lung cancer (rG = 0.27), colorectal cancer (rG = 0.22), ulcerative colitis (rG = 0.24); and schizophrenia (rG = 0.14).
Negative correlations: A lower genetic risk for breast cancer was slightly associated with a genetic predisposition for being shorter (rG = 0.14) and for having a higher BMI (rG = -0.11) [22].
Celiac Disease
People at higher risk for celiac disease are also at higher risk for type 1 diabetes, lupus erythematosus, and multiple sclerosis. People at lower risk for celiac disease are at a higher risk for psoriasis.
Our model for predicting celiac disease is based on genetic variants across the whole genome, but the bulk of the predictive accuracy comes from a small number of variants in the HLA region of chromosome 6. This region of the genome encodes a number of proteins that are involved in immune response; of particular relevance to celiac disease risk are different variants of the HLA-DQ gene.
Positive correlations: Using our HLA-based celiac disease model [23], we did an internal analysis using the UK Biobank and found individuals in the top 3% of predicted celiac disease risk are also at increased risk for type I diabetes (OR = 4.4; Chi-squared p-value = 3x10-30), lupus erythematosus (OR = 2.1, Chi-squared p-value = 1x10⁻⁴), and multiple sclerosis (OR = 1.8; Chi-squared p-value = 9x10⁻⁸).
Negative correlations: Individuals in the top 3% of predicted celiac disease risk are at decreased risk for psoriasis (OR = 0.7; Chi-squared p-value = 9x10⁻⁴).
Class III obesity
People at higher risk for high BMI are also at higher risk for coronary artery disease and type 2 diabetes. People at a lower risk for high BMI are at a slightly higher risk for anorexia nervosa.
Positive correlations: A study from 2015 [24] found people at higher risk for higher BMI were also at higher risk for type 2 diabetes (rG = 0.36) and for coronary artery disease (rG = 0.22).
Negative correlations: A lower genetic risk score for high BMI was slightly associated with a higher chance of developing anorexia nervosa (rG = -0.18)
Coronary artery disease (CAD)
To our knowledge, no genetic correlations have been reported which would suggest that low risk for CAD increases risk of any other diseases.
Positive correlations: A study from 2015 [24] found people at higher risk for CAD were also at higher risk for type 2 diabetes (rG = 0.38), as well as for several other cardiovascular risk factors such as high BMI (rG = 0.21), high blood levels of fasting glucose (rG = 0.14) and triglycerides (rG = 0.31).
Inflammatory bowel disease (IBD)
To our knowledge, no genetic correlations have been reported which would suggest that low risk for IBD increases risk of any other diseases.
Positive correlations: People at a higher risk for IBD are also at a higher risk for multiple sclerosis (rG ~ 0.3) [25], bipolar disorder (rG = 0.23), schizophrenia (rG = 0.14), and obsessive compulsive disorder (rG = 0.18) [26].
Prostate Cancer
To our knowledge, no significant genetic correlations have been reported which would suggest that low risk for prostate cancer increases risk of any other diseases.
Schizophrenia
People with a higher risk of schizophrenia may be at a higher risk of attention-deficit/hyperactivity disorder (ADHD), anorexia nervosa, autism spectrum disorder, major depressive disorder, obsessive compulsive disorder, bipolar disorder, breast cancer. They may also be more creative and have lower intelligence and BMI.
Positive correlations: People with a higher risk of schizophrenia may have a higher risk of ADHD, anorexia nervosa, autism spectrum disorder, major depressive disorder, obsessive compulsive disorder, and most notably, bipolar disorder (with an estimated rG of ~0.65). A higher genetic risk of schizophrenia is also associated with higher neuroticism [20] and, to a lesser extent, a higher risk of breast cancer (rG = 0.14) [22].
Negative correlations: People at higher risk for schizophrenia may be less creative. Measuring creativity directly is difficult; the study [27] which investigated this question most thoroughly used membership in the Icelandic national artistic societies of actors, dancers, musicians, visual artists and writers as a proxy measure for identifying creative individuals. They found that a genetic predictor of schizophrenia explains up to 26% of the variance in creativity. Schizophrenia is also associated with lower intelligence and BMI [20].
Type 1 diabetes
People with a higher risk for type 1 diabetes may also be at higher risk for celiac disease and rheumatoid arthritis. People with a lower risk for type 1 diabetes may also be at higher risk for psoriasis.
Our model for predicting type I diabetes is based on genetic variants across the whole genome, but the bulk of the predictive accuracy comes from a small number of variants in the HLA region of chromosome 6 [28]. This region of the genome encodes a number of proteins that are involved in immune response; of particular relevance to type I diabetes risk are different variants of the HLA-DQ gene.
Positive correlations: We did an internal analysis using the UK Biobank and found that individuals in the top 3% of predicted type I diabetes risk are also at increased risk for celiac disease (OR = 1.9; Chi-squared p-value = 8x10-13) and rheumatoid arthritis (OR = 1.1; Chi-squared p-value = 3x10⁻²).
Negative correlations: Individuals in the top 3% of predicted type I diabetes risk are at moderately decreased risk for psoriasis (OR = 0.7; Chi-squared p-value = 9x10⁻⁴).
Type 2 diabetes
To our knowledge, no genetic correlations have been reported which would suggest that low risk for type 2 diabetes increases risk of any other diseases.
Positive correlations: A study from 2015 [23] found people at higher risk for type 2 diabetes may also be at higher risk for cardiovascular disease and several other traits and diseases which together form the so-called metabolic syndrome: high BMI (rG = 0.27), high blood levels of fasting glucose and triglycerides, and low blood levels of HDL.
References
- Khera et. al. Whole-Genome Sequencing to Characterize Monogenic and Polygenic Contributions in Patients Hospitalized With Early-Onset Myocardial Infarction. Circulation. 2019;139:1593–1602. PMID: 30586733
- Udler et. al. Genetic Risk Scores for Diabetes Diagnosis and Precision Medicine. Endocrine Reviews. 40; 2019: 1500–1520. PMID: 31322649
- Khera et. al. Genome-wide polygenic scores for common diseases identify individuals with risk equivalent to monogenic mutations. Nat Genet. 2018; 50(9): 1219-1224. doi:10.1038/s41588-018-0183-z
- Lambert et. al. Towards clinical utility of polygenic risk scores. Hum. Mol. Genet. 2019; 28: R133–R142. PMID: 31363735
- Knowles et. al. Cardiovascular disease: The rise of the genetic risk score. PLoS Med 2018; 15: e1002546. PMID: 29601582
- Inouye et. al. Genomic Risk Prediction of Coronary Artery Disease in 480,000 Adults: Implications for Primary Prevention J. Am. Coll. Cardiol. 2018; 72(16): 1883-1893. PMID: 30309464
- Wolk et. al. Body Mass Index: A Risk Factor for Unstable Angina and Myocardial Infarction in Patients With Angiographically Confirmed Coronary Artery Disease. Circulation. 2003;108:2206–2211. PMID: 14557360
- Xia et. al. Validation of the first PGT-whole genome sequencing approach including mitochondrial variants bioRxiv 2022.04.14.488421; https://doi.org/10.1101/2022.04.14.488421
- Lencz et. al. Utility of polygenic embryo screening for disease depends on the selection strategy eLife 2021; 10: e64716. PMID: 34635206
- Lello et. al. Sibling validation of polygenic risk scores and complex trait prediction. Scientific Reports 2020; 10: 13190 PMID: 32764582
- Howe et. al. Within-sibship GWAS improve estimates of direct genetic effects. bioRxiv 2021; https://doi.org/10.1101/2021.03.05.433935
- Privé et. al. High-resolution portability of 245 polygenic scores when derived and applied in the same cohort. Am J Hum Genet 2022; 109: 12-23. https://doi.org/10.1016/j.ajhg.2021.11.008
- Weissbrod et. al. Leveraging fine-mapping and multipopulation training data to improve cross-population polygenic risk scores. Nat Genet 2022; 54: 450–458 PMID: 35393596
- Ruan et. al. Improving Polygenic Prediction in Ancestrally Diverse Populations Nat Genet 2022; 54: 573–580 PMID: 35513724
- Martin et. al. Clinical use of current polygenic risk scores may exacerbate health disparities. Nat Genet 2019; 51: 584–591 PMID: 30926966
- Farrer et. al. Effects of Age, Sex, and Ethnicity on the Association Between Apolipoprotein E Genotype and Alzheimer Disease: A Meta-analysis. JAMA. 1997; 278:1349–1356. PMID: 9343467
- Mahley et. al. Apolipoprotein E: structure determines function, from atherosclerosis to Alzheimer's disease to AIDS. J Lipid Res. 2009; 50 Suppl(Suppl): S183-8. PMID: 19106071
- Oriá et. al. ApoE polymorphisms and diarrheal outcomes in Brazilian shanty town children. Braz J Med Biol Res. 2010; 43:249-256. PMID: 20401432
- Pulit et. al. Atrial fibrillation genetic risk differentiates cardioembolic stroke from other stroke subtypes. Neurol Genet. 2018; 4: e293. PMID: 30584597
- Brainstorm Consortium, et. al. Analysis of shared heritability in common disorders of the brain. Science. 2018; 360: eaap8757 PMID: 29930110
- Demange et. al. Investigating the genetic architecture of noncognitive skills using GWAS-by-subtraction. Nat Genet 2021; 53: 35–44. PMID: 33414549
- Lindström et al. Quantifying the Genetic Correlation between Multiple Cancer Types. Cancer Epidemiol Biomarkers Prev. 2017; 26: 1427-1435. PMID: 28637796
- Sharp et. al. A single nucleotide polymorphism genetic risk score to aid diagnosis of coeliac disease: a pilot study in clinical care. AP&T 2020; 52: 1165-1173 PMID: 32790217
- Bulik-Sullivan et. al. An atlas of genetic correlations across human diseases and traits. Nat Genet 2015; 47: 1236–1241 PMID: 26414676
- Yang et. al. Investigating the shared genetic architecture between multiple sclerosis and inflammatory bowel diseases. Nat Commun 2021; 12: 5641 . PMID: 34561436
- Tylee et. al. Genetic correlations among psychiatric and immune-related phenotypes based on genome-wide association data. Am J Med Genet B Neuropsychiatr Genet. 2018; 177: 641-657. PMID: 30325587
- Power et. al. Polygenic risk scores for schizophrenia and bipolar disorder predict creativity. Nat Neurosci 2015; 18: 953–955. PMID: 26053403
- Sharp et. al. Development and Standardization of an Improved Type 1 Diabetes Genetic Risk Score for Use in Newborn Screening and Incident Diagnosis. Diabetes Care. 2019; 42: 200-207. PMID: 30655379


